Fig. 8
Download original image
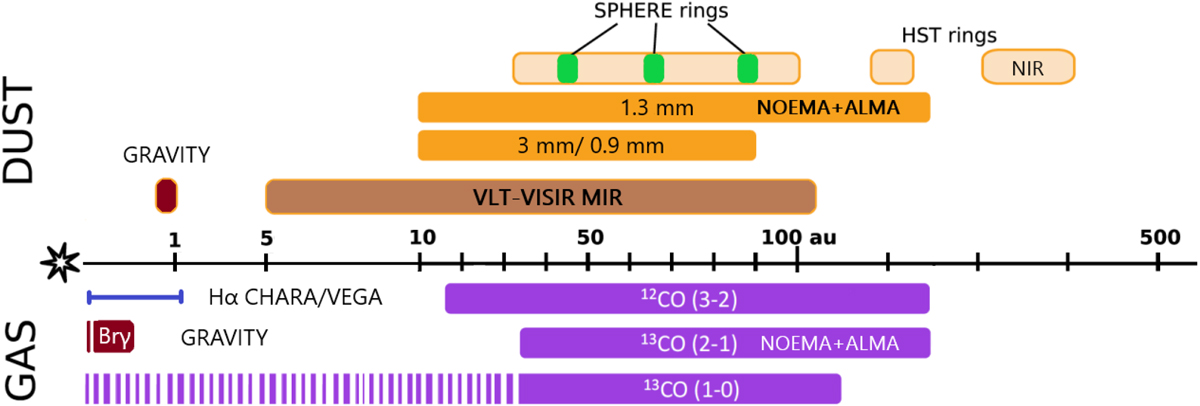
Visualization of dust and gas distribution in HD 141569 (adapted from Di Folco et al. 2020). Shown in light orange are the optical–IR dust rings detected in scattered light by HTS (e.g., Augereau et al. 1999; Clampin et al. 2003; Konishi et al. 2016). Overplotted in green are the three near-IR dust ringlets detected by VLT/SPHERE (Perrot et al. 2016). The extended millimeter continuum emission detected by ALMA (Miley et al. 2018) and NOEMA (Di Folco et al. 2020) is shown in orange. The large brown ring represents the mid-IR continuum emission detected by VLT-VISIR and modeled by Thi et al. (2014). In dark red is shown the near-IR dust emission detected by GRAVITY and studied in this work. In the same color is the Brγ line emitting gas region detected by GRAVITY, also analyzed in this work. In blue is depicted the Hα line region based on the upper-limit size estimated by Mendigutía et al. (2017). Finally, in purple is shown the CO gas region whose emissions were detected by ALMA (e.g., White et al. 2016; Miley et al. 2018) and NOEMA (Di Folco et al. 2020).
Current usage metrics show cumulative count of Article Views (full-text article views including HTML views, PDF and ePub downloads, according to the available data) and Abstracts Views on Vision4Press platform.
Data correspond to usage on the plateform after 2015. The current usage metrics is available 48-96 hours after online publication and is updated daily on week days.
Initial download of the metrics may take a while.