Open Access
Fig. 5
Download original image
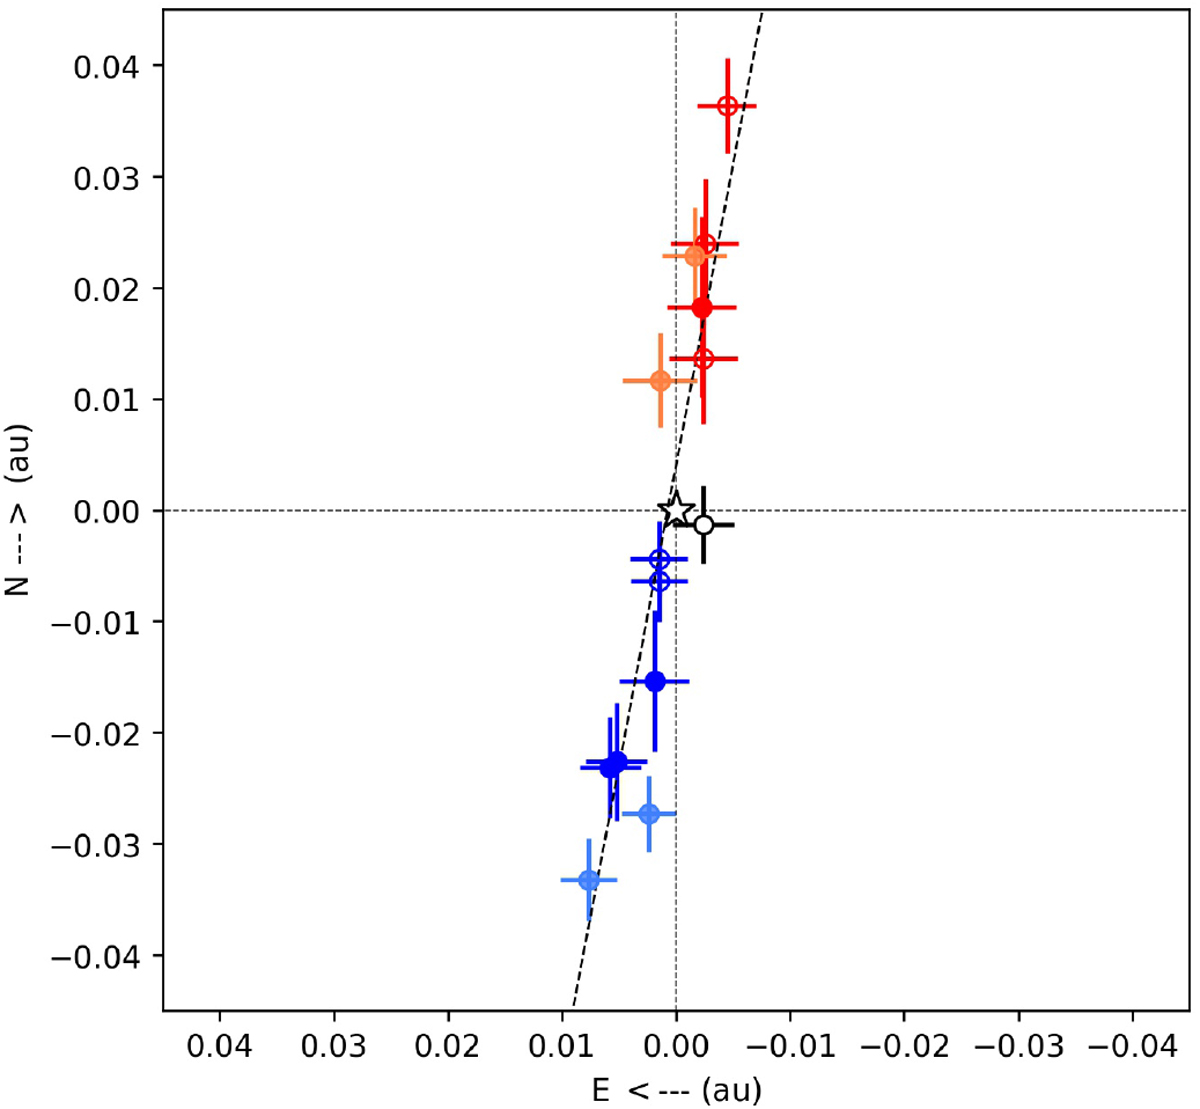
Deprojected photocenter shifts. The colors refer to the different spectral channels and velocities, as shown in Fig. 4. The dashed black line, derived through a linear fit of the photocenter shifts, represents the gas region position angle.
Current usage metrics show cumulative count of Article Views (full-text article views including HTML views, PDF and ePub downloads, according to the available data) and Abstracts Views on Vision4Press platform.
Data correspond to usage on the plateform after 2015. The current usage metrics is available 48-96 hours after online publication and is updated daily on week days.
Initial download of the metrics may take a while.