Fig. 3
Download original image
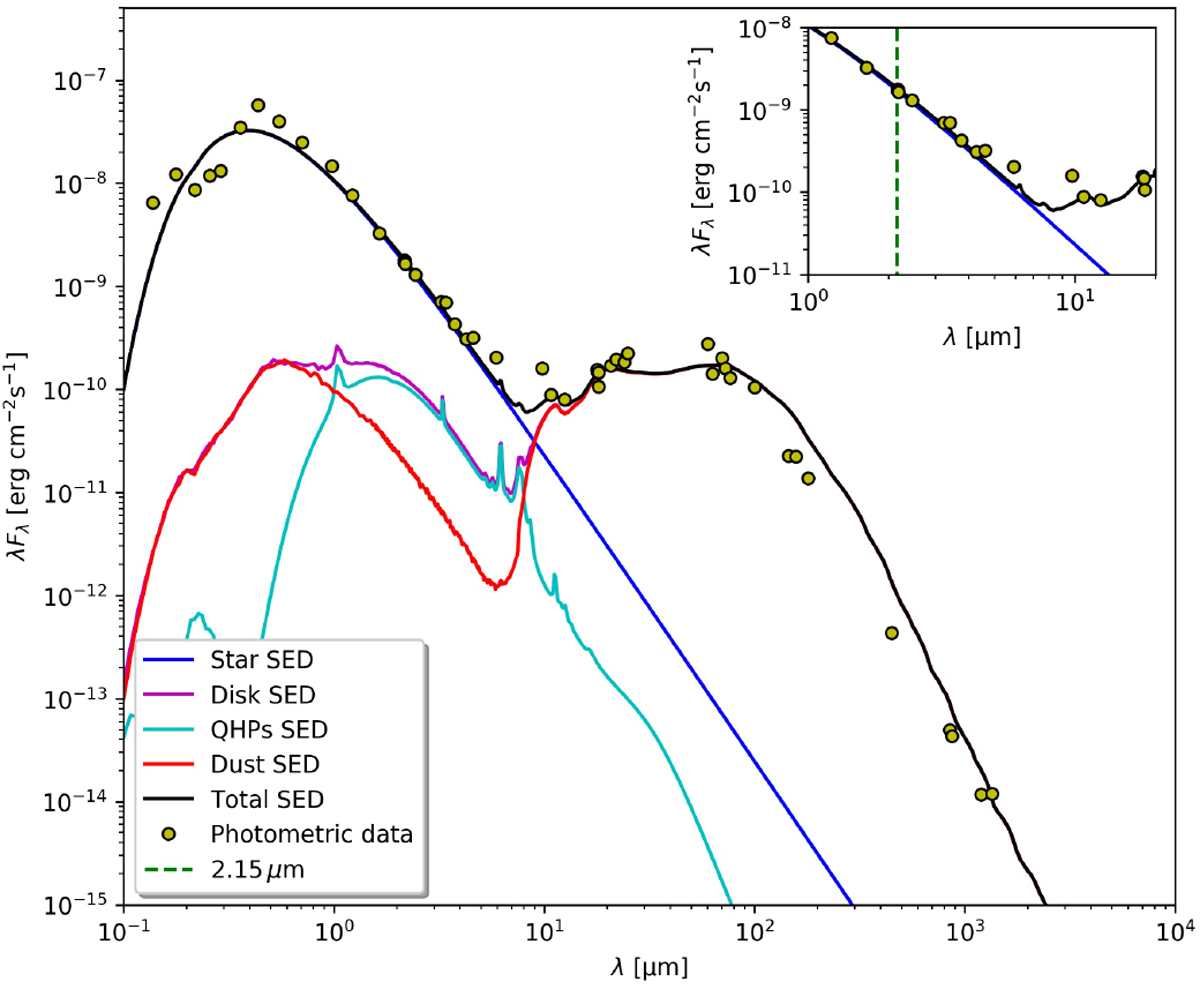
MCMax SED (black line) of the model described in Table 2. The yellow circles are HD 141569 photometric data listed in Table G.1. The blue line represents the star SED modeled as a black body. The cyan line represents the QHPs SED and the red line the silicates SED. The magenta line is the total disk SED accounting for both QHP and silicate emission. The top right plot focuses on the first 10 μm wavelength range of the SED.
Current usage metrics show cumulative count of Article Views (full-text article views including HTML views, PDF and ePub downloads, according to the available data) and Abstracts Views on Vision4Press platform.
Data correspond to usage on the plateform after 2015. The current usage metrics is available 48-96 hours after online publication and is updated daily on week days.
Initial download of the metrics may take a while.