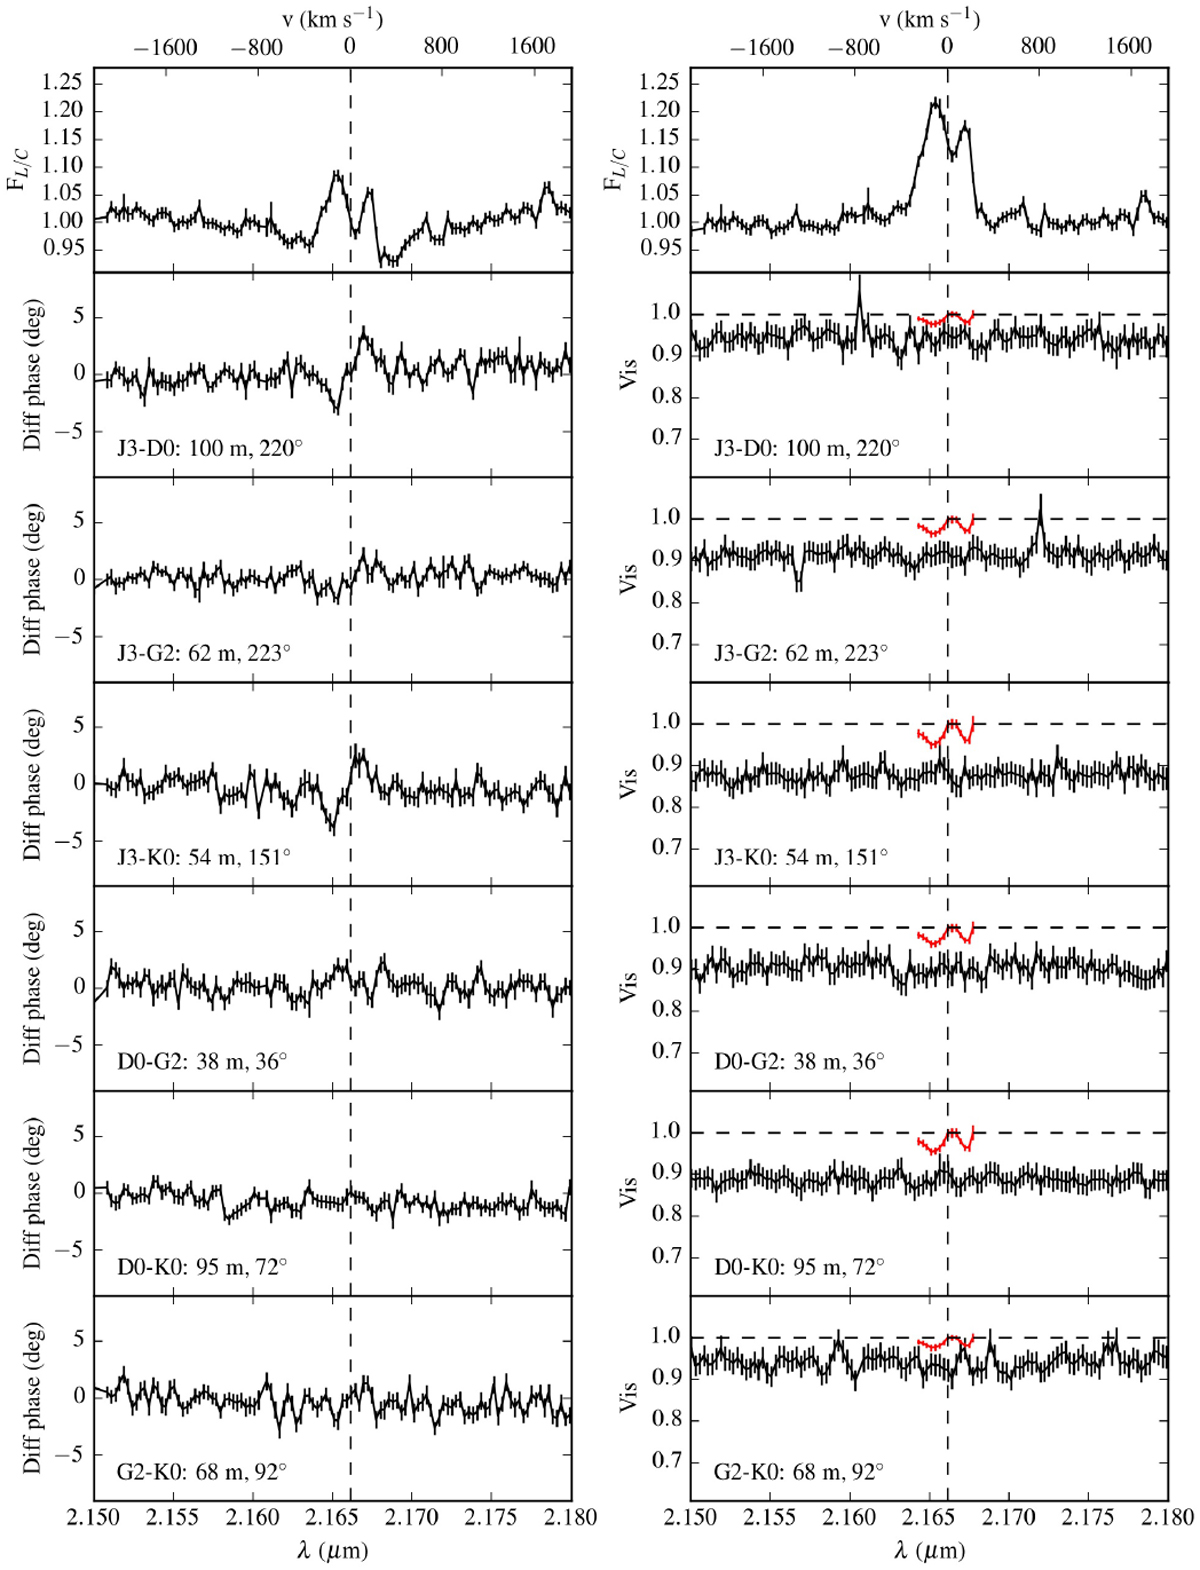
Fig. 2
Download original image
Science channel data of July 2019. Top left: wavelength-calibrated continuum-normalized spectrum,corrected for telluric lines. Top right: same as top left, but corrected for the Brγ photospheric absorption. Differential phases (left column) and visibilities (right column) along the six GRAVITY baselines. The red lines in the visibility plots show the pure-line visibilities.
Current usage metrics show cumulative count of Article Views (full-text article views including HTML views, PDF and ePub downloads, according to the available data) and Abstracts Views on Vision4Press platform.
Data correspond to usage on the plateform after 2015. The current usage metrics is available 48-96 hours after online publication and is updated daily on week days.
Initial download of the metrics may take a while.