Fig. B.1
Download original image
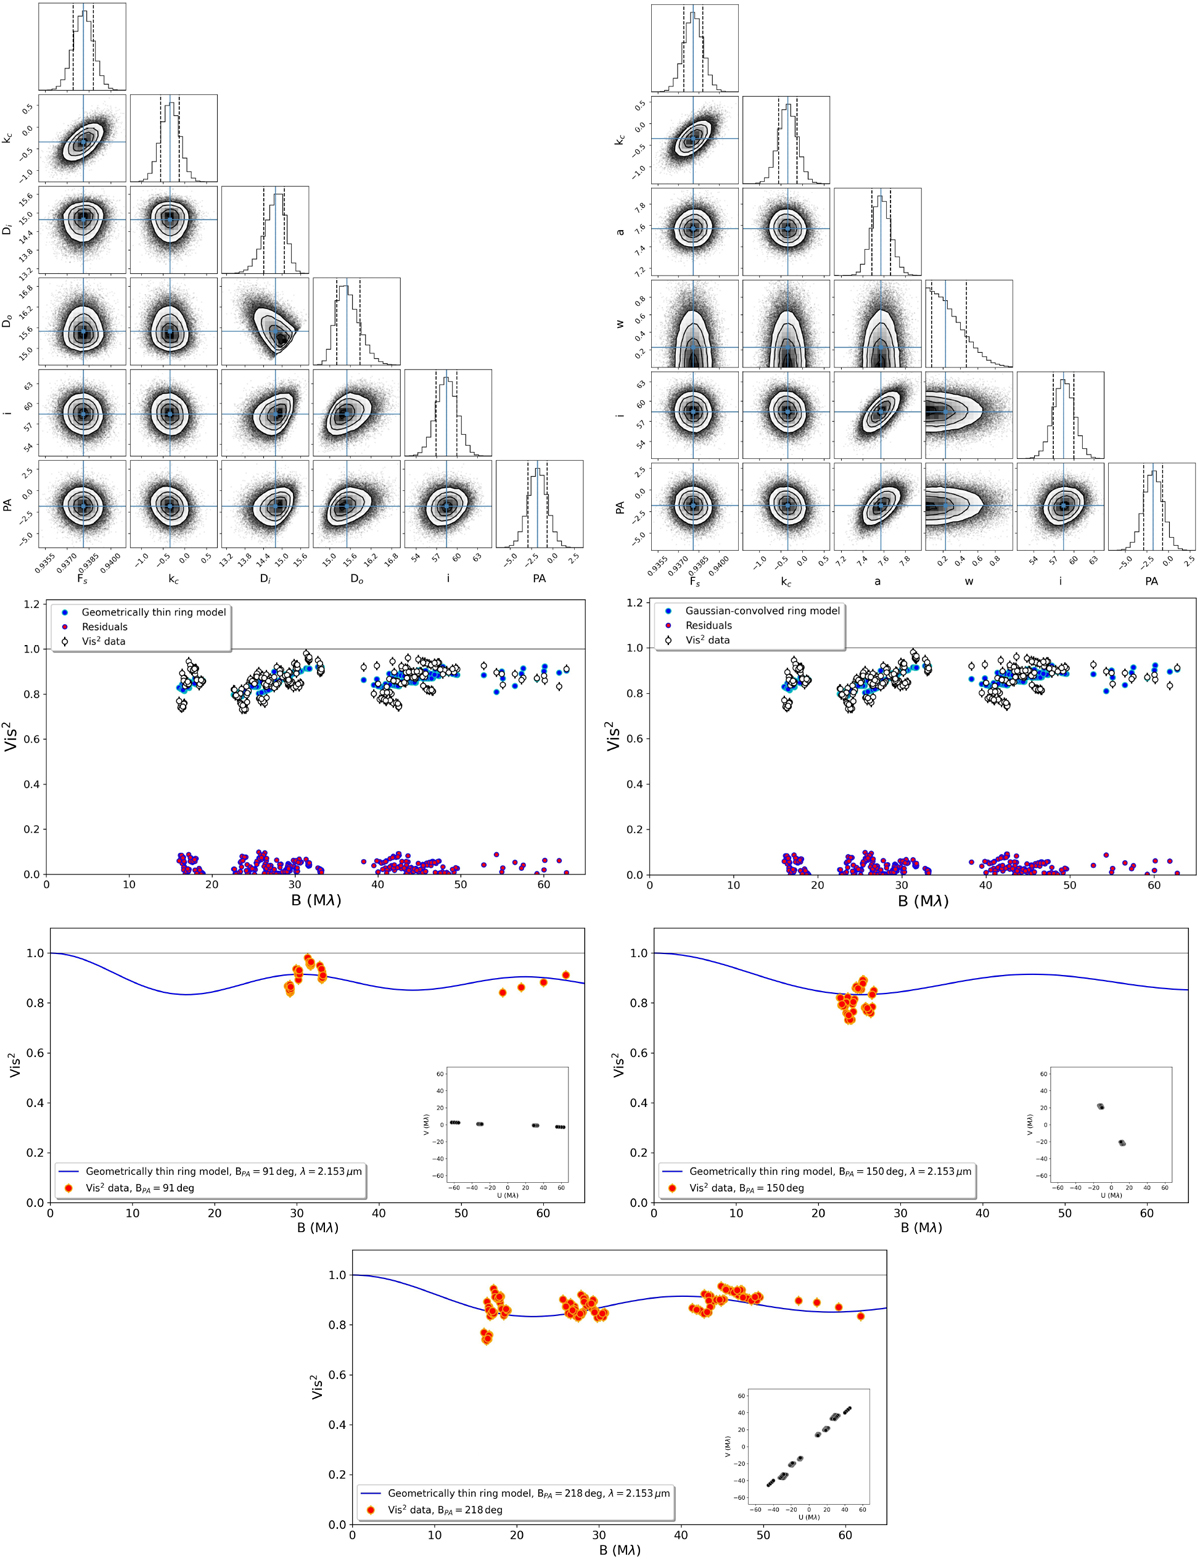
Results of the FT data fit. Top: MCMC marginal posterior distributions of the fitted parameters. The blue lines identify the median of the distributions for the geometrically thin ring model (left) and for the Gaussian-convolved infinitesimally thin ring model (right). Center: Comparison between the model squared visibilities (blue dots) and the observational data (white–black dots). The red dots represent the absolute residuals. Bottom: Vis2 best fit to the geometrically thin ring model (blue continuous line) at λ=2.153 μm for three different position angles identified in the insets. The visibility data are shown for all spectral channels by the red circles.
Current usage metrics show cumulative count of Article Views (full-text article views including HTML views, PDF and ePub downloads, according to the available data) and Abstracts Views on Vision4Press platform.
Data correspond to usage on the plateform after 2015. The current usage metrics is available 48-96 hours after online publication and is updated daily on week days.
Initial download of the metrics may take a while.