Fig. 1.
Download original image
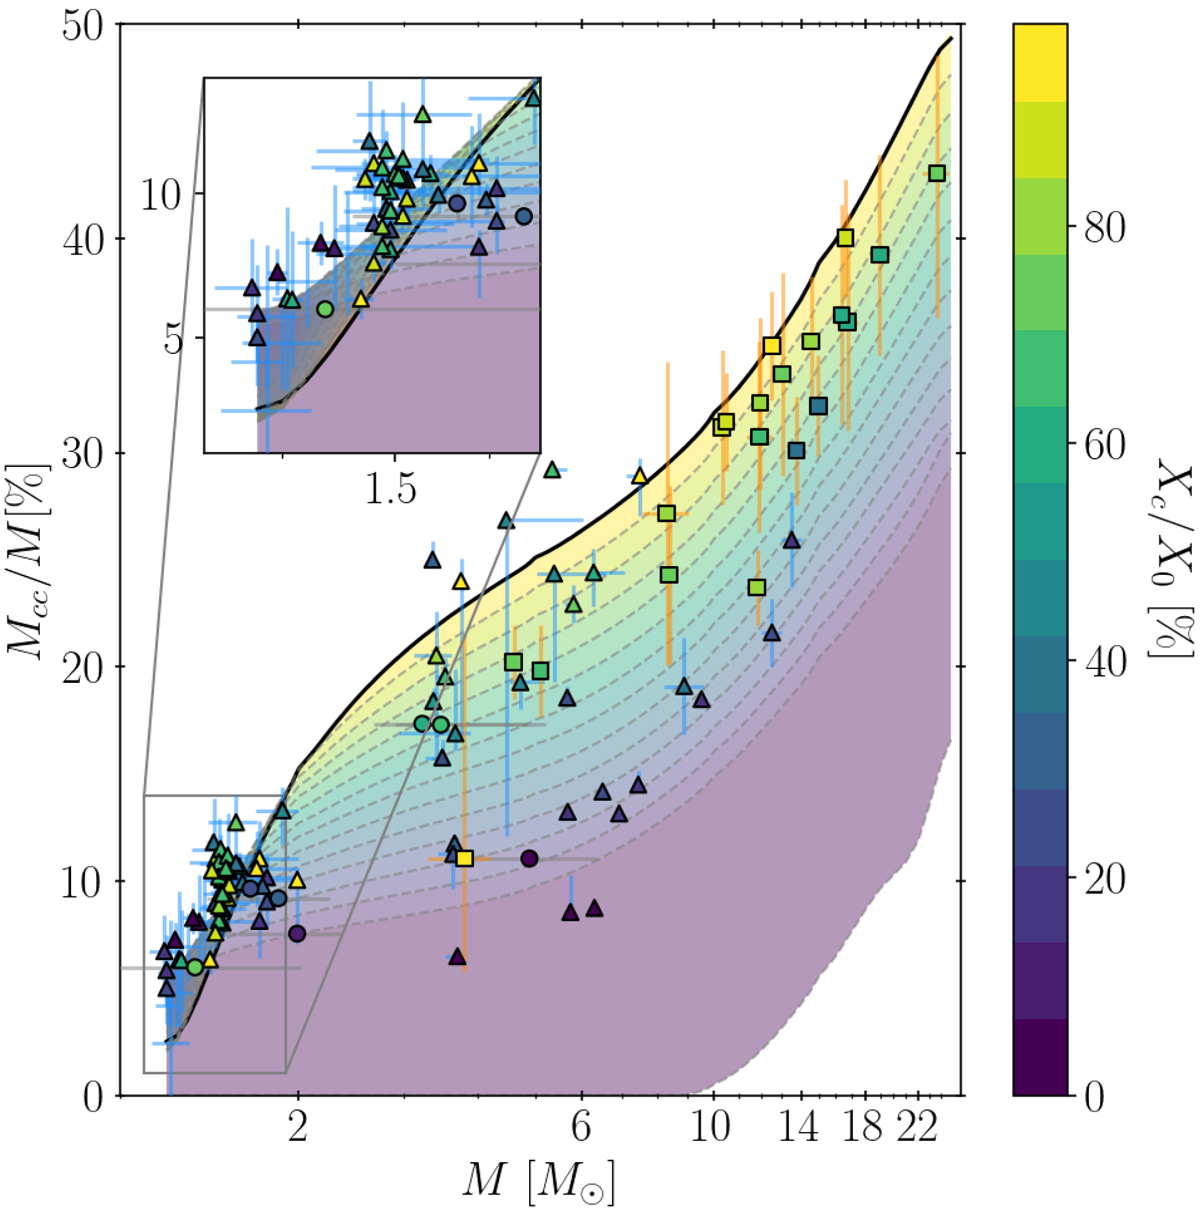
Convective core mass (Mcc) vs. initial mass (M) of the star. Solid and dashed lines correspond to fractional core mass at specified points in evolution. The colour of each region corresponds to the fractional core hydrogen content as indicated by the colour bar. The colour of each individual marker corresponds to the inferred fractional core hydrogen content of the best model. Squares with orange uncertainties denote values obtained from binary systems, circles with blue uncertainties denote values obtained from binary systems with at least one pulsating component, and triangles with grey uncertainties denote values obtained from pulsating stars. References for values and their uncertainties are listed in Table A.1.
Current usage metrics show cumulative count of Article Views (full-text article views including HTML views, PDF and ePub downloads, according to the available data) and Abstracts Views on Vision4Press platform.
Data correspond to usage on the plateform after 2015. The current usage metrics is available 48-96 hours after online publication and is updated daily on week days.
Initial download of the metrics may take a while.