Free Access
Fig. 9.
Download original image
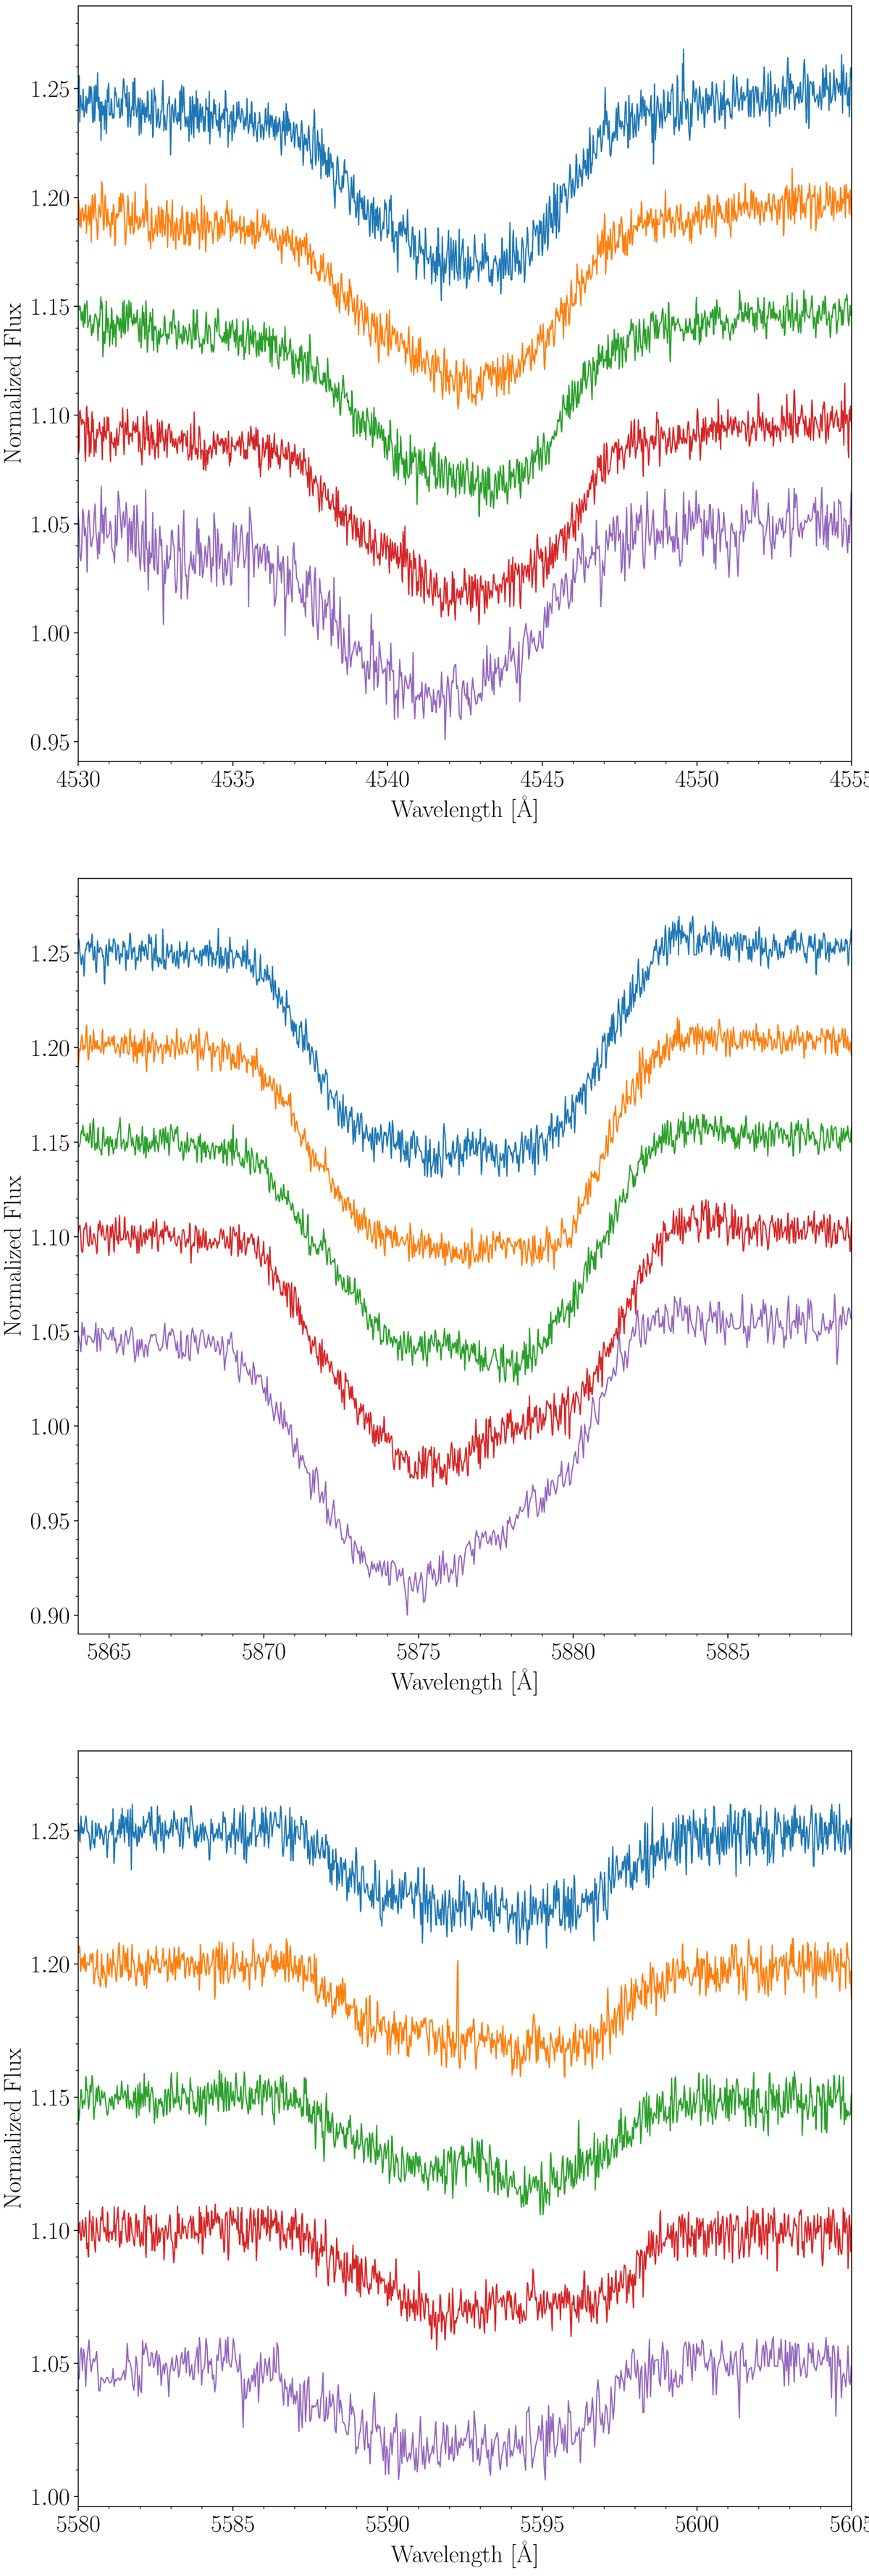
He II λ4542 (upper), He I λ5876 (mid), and O III λ5592 (lower) lines of 68 Cyg for several epochs to show its variability. The spectra shown are: 110613_M (blue), 110617_M_4 (red), 110619_M (green), 110619_M_2 (orange), and 140607_C (purple).
Current usage metrics show cumulative count of Article Views (full-text article views including HTML views, PDF and ePub downloads, according to the available data) and Abstracts Views on Vision4Press platform.
Data correspond to usage on the plateform after 2015. The current usage metrics is available 48-96 hours after online publication and is updated daily on week days.
Initial download of the metrics may take a while.