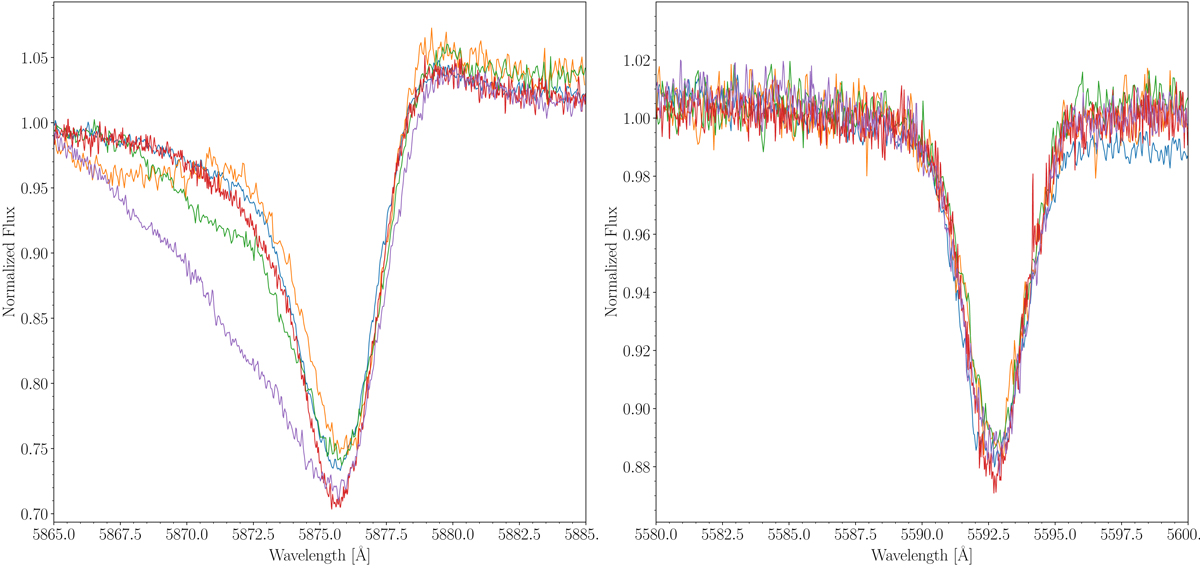
Fig. 2.
Download original image
Diagnostic lines of 9 Sge that show the spectral variability of the star. Left panel: He I λ5876 line of 9 Sge at different epochs. It shows a P-Cygni profile that varies due to the effect of the stellar wind. Right panel: O III λ5592 line. It shows a more symmetric profile, indicating that the line is less affected by winds. Plotted spectra are: 040530_F (blue), 040827_P (green), 051110_P (orange), 110615_M_3 (red), and 110910_I_2 (purple). See Table A.1 for a description of naming convention used to identify each spectrum.
Current usage metrics show cumulative count of Article Views (full-text article views including HTML views, PDF and ePub downloads, according to the available data) and Abstracts Views on Vision4Press platform.
Data correspond to usage on the plateform after 2015. The current usage metrics is available 48-96 hours after online publication and is updated daily on week days.
Initial download of the metrics may take a while.