Fig. 5
Download original image
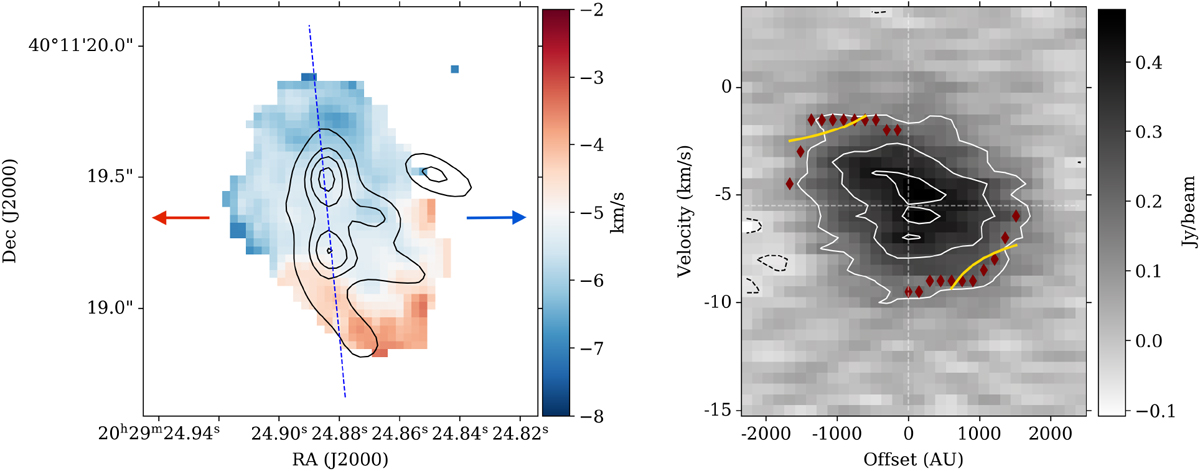
Left panel: intensity-weighted peak velocity map of the averaged vibrationally excited HCN emission. The black contours mark the 3, 5, 6, and 7σ 843 μm continuum emission. The arrows show the direction of the large scale, east-west outflow seen in CO(2−1) emission, with blue and red colors indicating the blueshifted and redshifted line emission (see Gieser et al. 2019). Right panel: PV diagram for the averaged vibrationally excited HCN emission extracted from a slice along the dashed line shown in the left panel. The width of the PV slice is 9 pixels (~0′′.28). The solid, white contours mark the 5, 10, and 14σ emission level (with 1σ = 30 mJy beam−1). The gray dashed contours mark the −2σ negative emission levels. The red diamonds show the extreme velocities at each radius from the protostar at 5σ emission level which are then fitted using KeplerFit. The fits are shown with yellow solid lines.
Current usage metrics show cumulative count of Article Views (full-text article views including HTML views, PDF and ePub downloads, according to the available data) and Abstracts Views on Vision4Press platform.
Data correspond to usage on the plateform after 2015. The current usage metrics is available 48-96 hours after online publication and is updated daily on week days.
Initial download of the metrics may take a while.