Fig. 4
Download original image
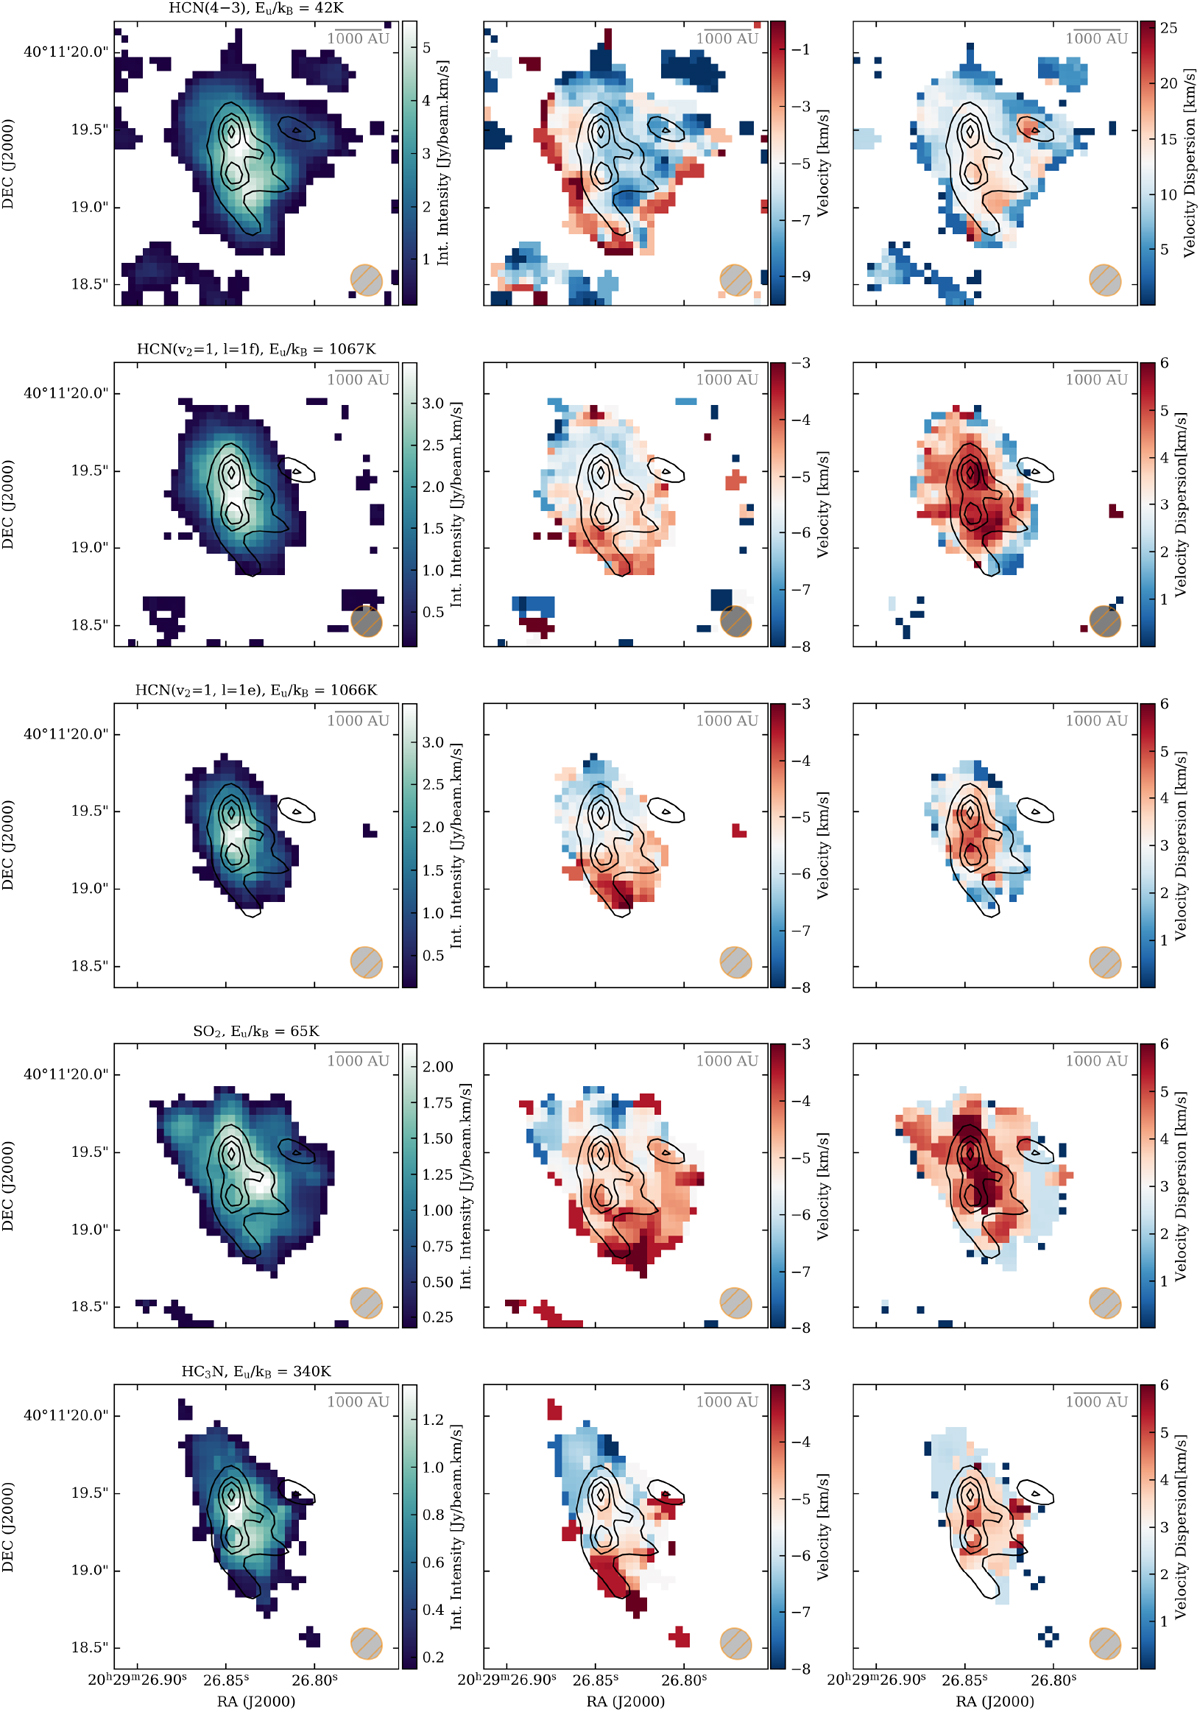
Moment maps of the five most prominent lines in our observations. Each row represents a line and the columns, from left to right, show the integrated intensity, intensity-weighted velocity, and velocity dispersion maps. The contours in each sub-panel indicate the 3, 5, 6 and 7σ emission levels of the 843 μm continuum emission. The beam size of the observations are shown in the bottom right corner of each sub-panel. The source velocity is −5.5 km s−1.
Current usage metrics show cumulative count of Article Views (full-text article views including HTML views, PDF and ePub downloads, according to the available data) and Abstracts Views on Vision4Press platform.
Data correspond to usage on the plateform after 2015. The current usage metrics is available 48-96 hours after online publication and is updated daily on week days.
Initial download of the metrics may take a while.