Fig. 2
Download original image
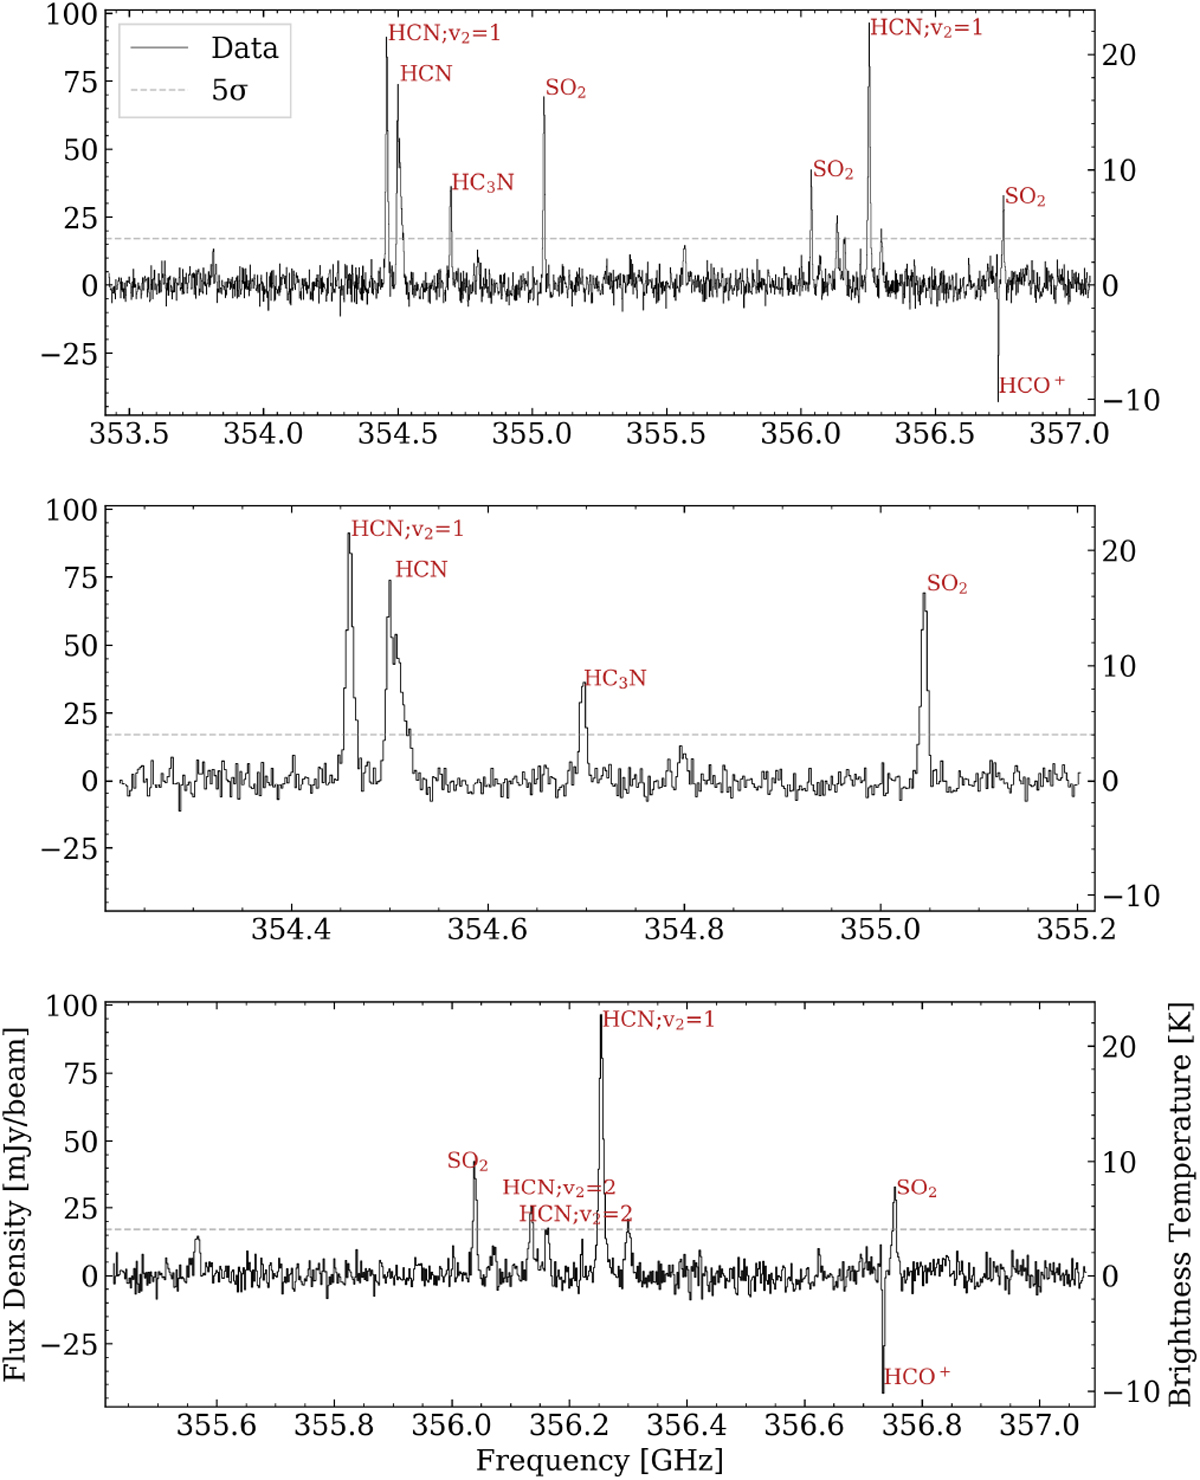
Upper panel: low spectral resolution spectrum spatially averaged over a 0′′.7 × 0′′.7 region centered at α = 20h29m24s.876, δ = +40°11′19′′.216 covering cores A, B, C. Middle panel: zoom-in to the frequency range from 354.2 to 355.3 GHz. Bottom panel: zoom in to the frequency range from 356.4 to 357.1 GHz. The horizontal gray dashed line corresponds to the 5σ signal-to-noise level (σ = 3.4 mJy beam−1).
Current usage metrics show cumulative count of Article Views (full-text article views including HTML views, PDF and ePub downloads, according to the available data) and Abstracts Views on Vision4Press platform.
Data correspond to usage on the plateform after 2015. The current usage metrics is available 48-96 hours after online publication and is updated daily on week days.
Initial download of the metrics may take a while.