Fig. 1
Download original image
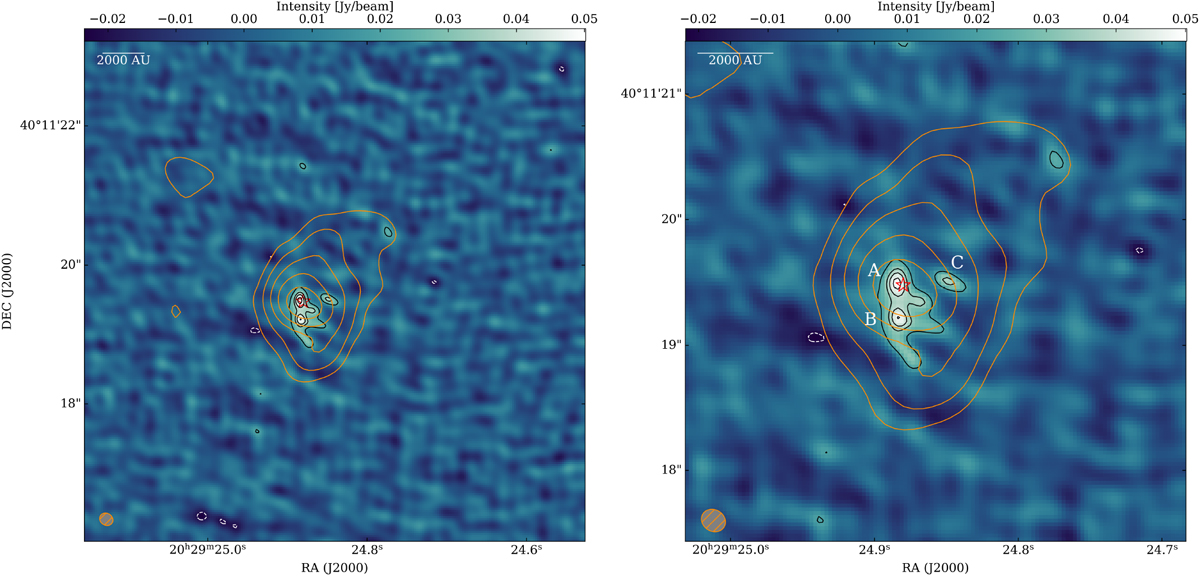
843 μm continuum flux density map. Left panel: the black contours mark 843 μm continuum emission levels of 3, 5, 6, and 7σ with σ = 6.7 mJy beam−1. The white dashed contours mark the negative emission levels of 3σ. The orange contours mark the 5, 10, 20, 40, and 80σ continuum emission levels at 1.3 mm (σ = 0.59 mJy beam−1) in both panels. Right panel: close-up view of the central 13 000 AU region. Three cores, A, B, and C, detected with ≥5σ confidenceare marked with the corresponding labels. The beam size and a scale bar of the 843 μm observations is shown in the bottom left and top left corner in each panel, respectively. The red star in both panels indicates the position of the protostar, assuming that it is located at the 1.3 mm continuum peak.
Current usage metrics show cumulative count of Article Views (full-text article views including HTML views, PDF and ePub downloads, according to the available data) and Abstracts Views on Vision4Press platform.
Data correspond to usage on the plateform after 2015. The current usage metrics is available 48-96 hours after online publication and is updated daily on week days.
Initial download of the metrics may take a while.