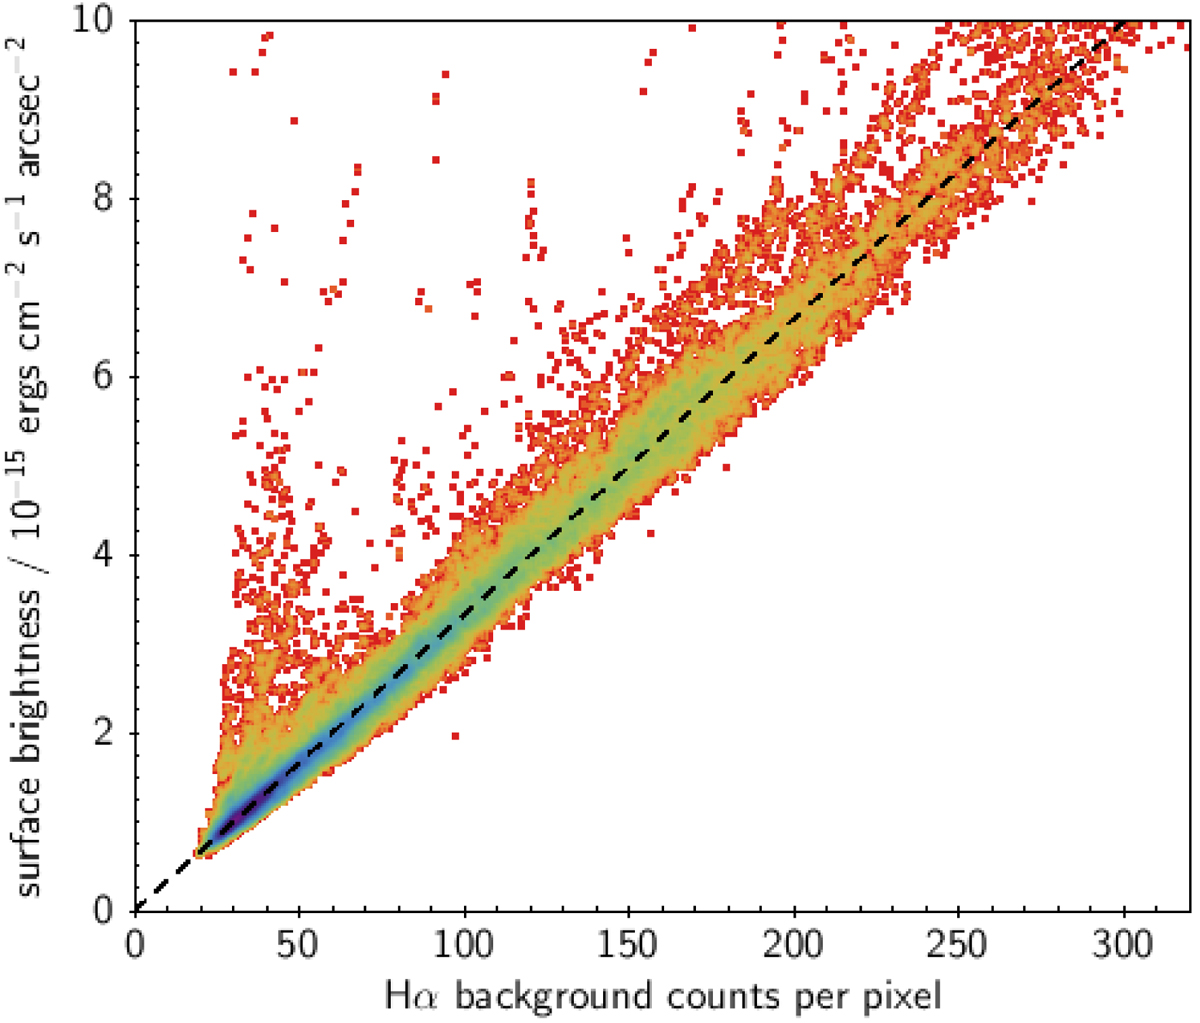
Fig. 2.
Download original image
Density plot of background surface brightness in the Hα band as a function of measured mean sky level in counts. The colour scale is logarithmic, with blue representing the highest density of points. The images used to build this diagram are the IGAPS uniformly calibrated set, which enables validated conversion of the sky counts to surface brightness via each image’s zero point. The black dashed line has a gradient of 3.32 × 10⁻¹⁷ ergs cm−2 s−1 arcsec−2 per count.
Current usage metrics show cumulative count of Article Views (full-text article views including HTML views, PDF and ePub downloads, according to the available data) and Abstracts Views on Vision4Press platform.
Data correspond to usage on the plateform after 2015. The current usage metrics is available 48-96 hours after online publication and is updated daily on week days.
Initial download of the metrics may take a while.