Fig. A.1.
Download original image
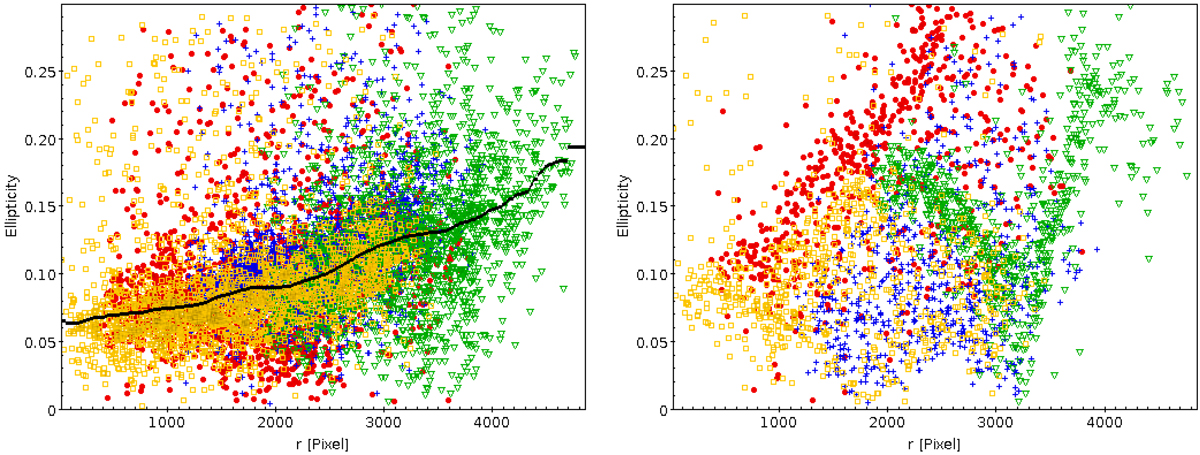
Dependence of pipeline measured source ellipticity on the distance to the instrument rotator centre. The data are from IGAPS field 6395o and show the sources from the g image r584231 on the left, and from the URGO image r584230 on the right. On the left the data of all four CCDs are shown together with a running median plotted as a black line. On the right the data from each CCD are shown with different colours and symbols: CCD#1 as red filled dots, CCD#2 as blue plus signs, CCD#3 as green triangles, and CCD#4 as orange squares.
Current usage metrics show cumulative count of Article Views (full-text article views including HTML views, PDF and ePub downloads, according to the available data) and Abstracts Views on Vision4Press platform.
Data correspond to usage on the plateform after 2015. The current usage metrics is available 48-96 hours after online publication and is updated daily on week days.
Initial download of the metrics may take a while.