Fig. 12.
Download original image
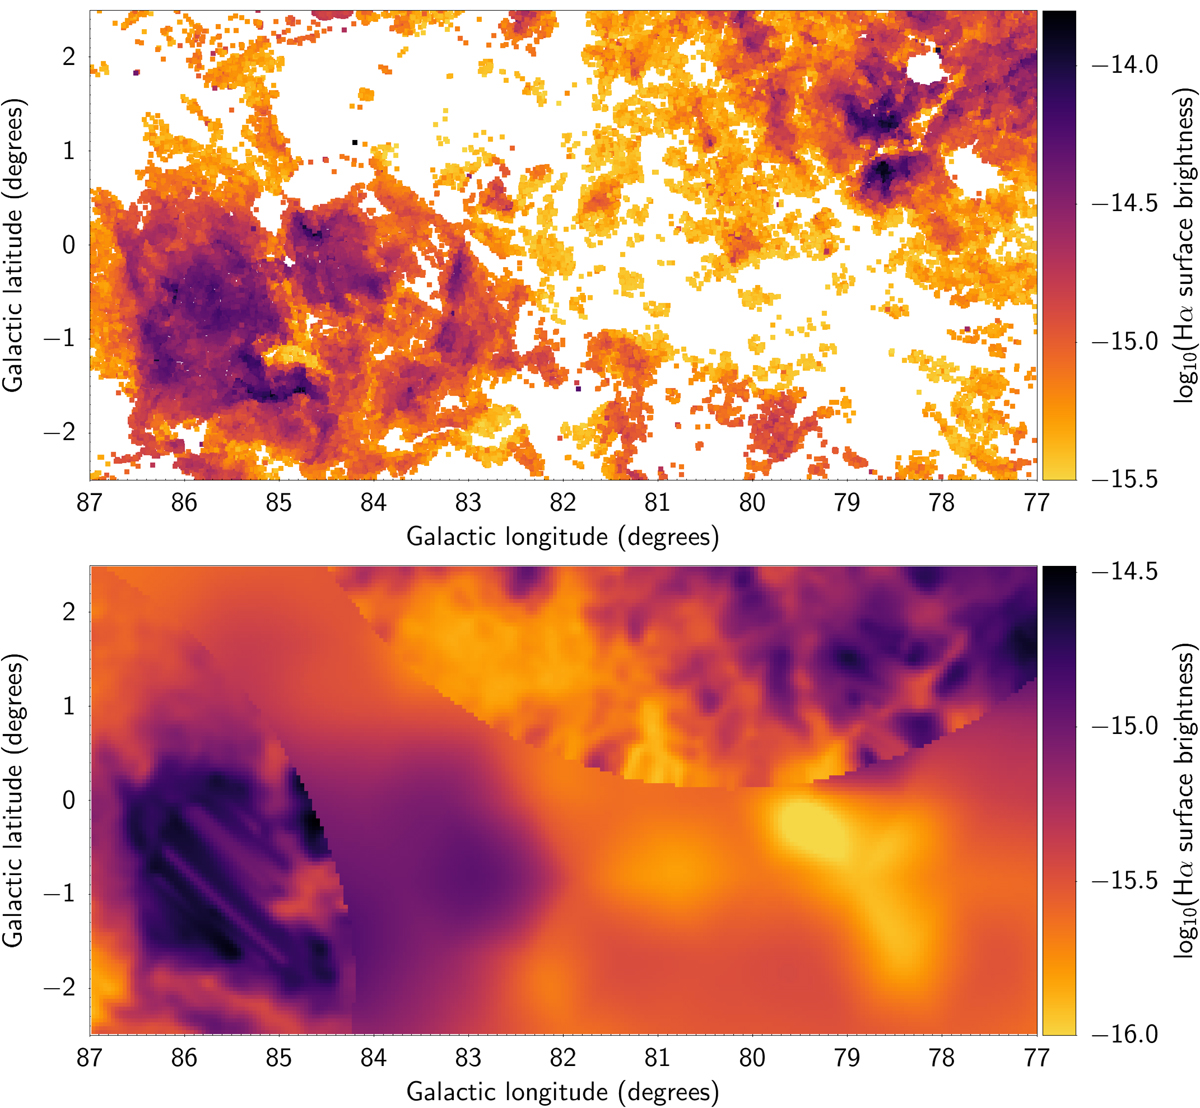
Comparison between HAGRID generated flux levels and the calibrated map of Finkbeiner (2003). Top: map of HAGRID-selected positions in the Cygnus-X region of the northern Galactic plane. Every selected position has been coloured according to the logarithm of the estimated surface brightness (in ergs cm−2 s−1 arcsec−2). White areas will have log(surface brightness) < − 15.5. The region shown spans 50 sq. deg., or 3.6% of the total area processed, and contains 20% of the identified candidate target positions. It is the most line emission-rich part of the northern plane. Bottom: same area in the Finkbeiner (2003) Hα map, with 6 arcmin pixels. The data available in this region are a combination of images from VTSS (circular footprint) and WHAM (making up the much coarser resolution background).
Current usage metrics show cumulative count of Article Views (full-text article views including HTML views, PDF and ePub downloads, according to the available data) and Abstracts Views on Vision4Press platform.
Data correspond to usage on the plateform after 2015. The current usage metrics is available 48-96 hours after online publication and is updated daily on week days.
Initial download of the metrics may take a while.