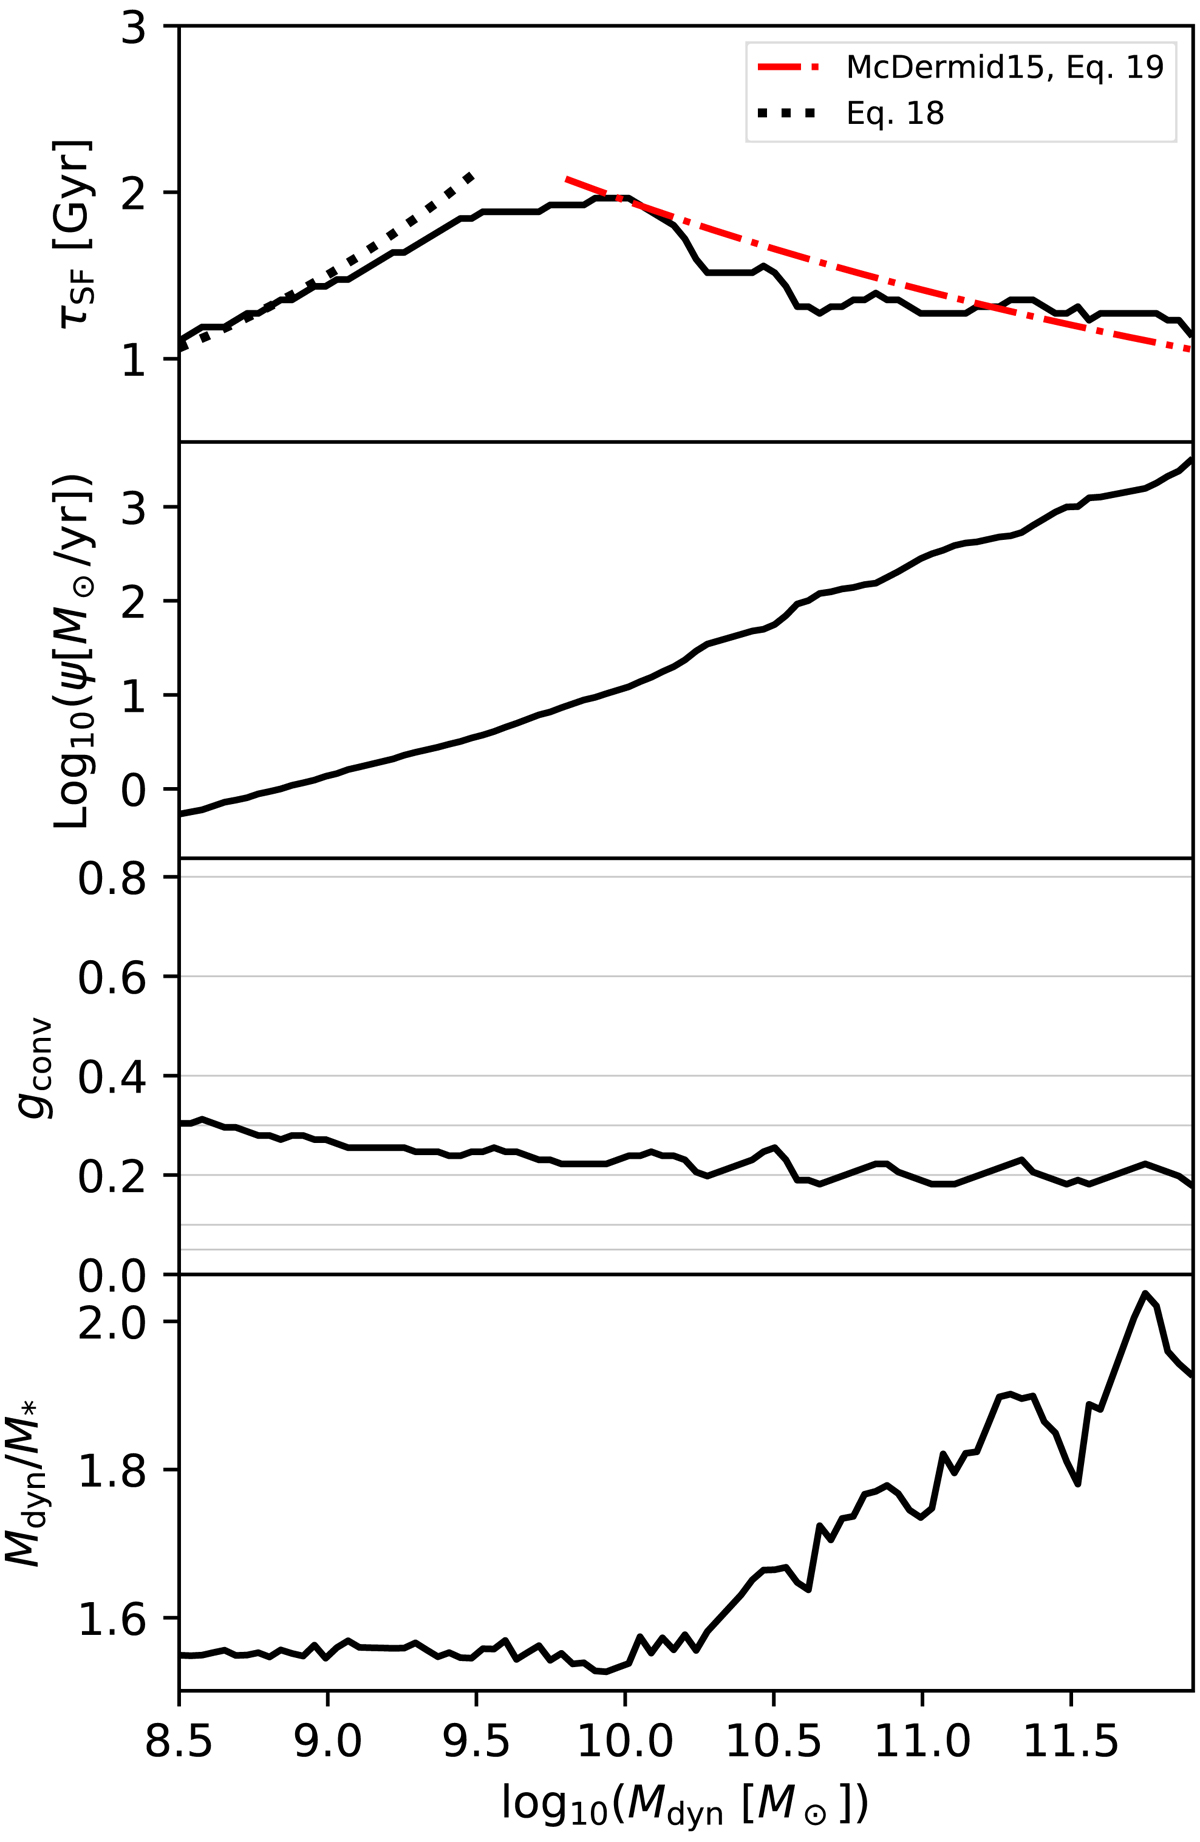
Fig. 8.
Download original image
SFT, SFR, gas-conversion parameter, and dynamical-mass-to-stellar mass ratio of our best-fit model, from the top to the bottom panel, for the error function model. The solid black line in the top panel is the same as the yellow ridge line of Fig. 7. The black dotted and the red dash-dotted curves in the top panel follow the same relation as in Fig. 7, described by Eqs. (18) and (19), respectively. The thin horizontal lines indicate gconv values applied in our galaxy model (see Sect. 4), where gconv ≈ 1/3 is about the star formation efficiency found for embedded star clusters (Sect. 2.1).
Current usage metrics show cumulative count of Article Views (full-text article views including HTML views, PDF and ePub downloads, according to the available data) and Abstracts Views on Vision4Press platform.
Data correspond to usage on the plateform after 2015. The current usage metrics is available 48-96 hours after online publication and is updated daily on week days.
Initial download of the metrics may take a while.