Fig. 7.
Download original image
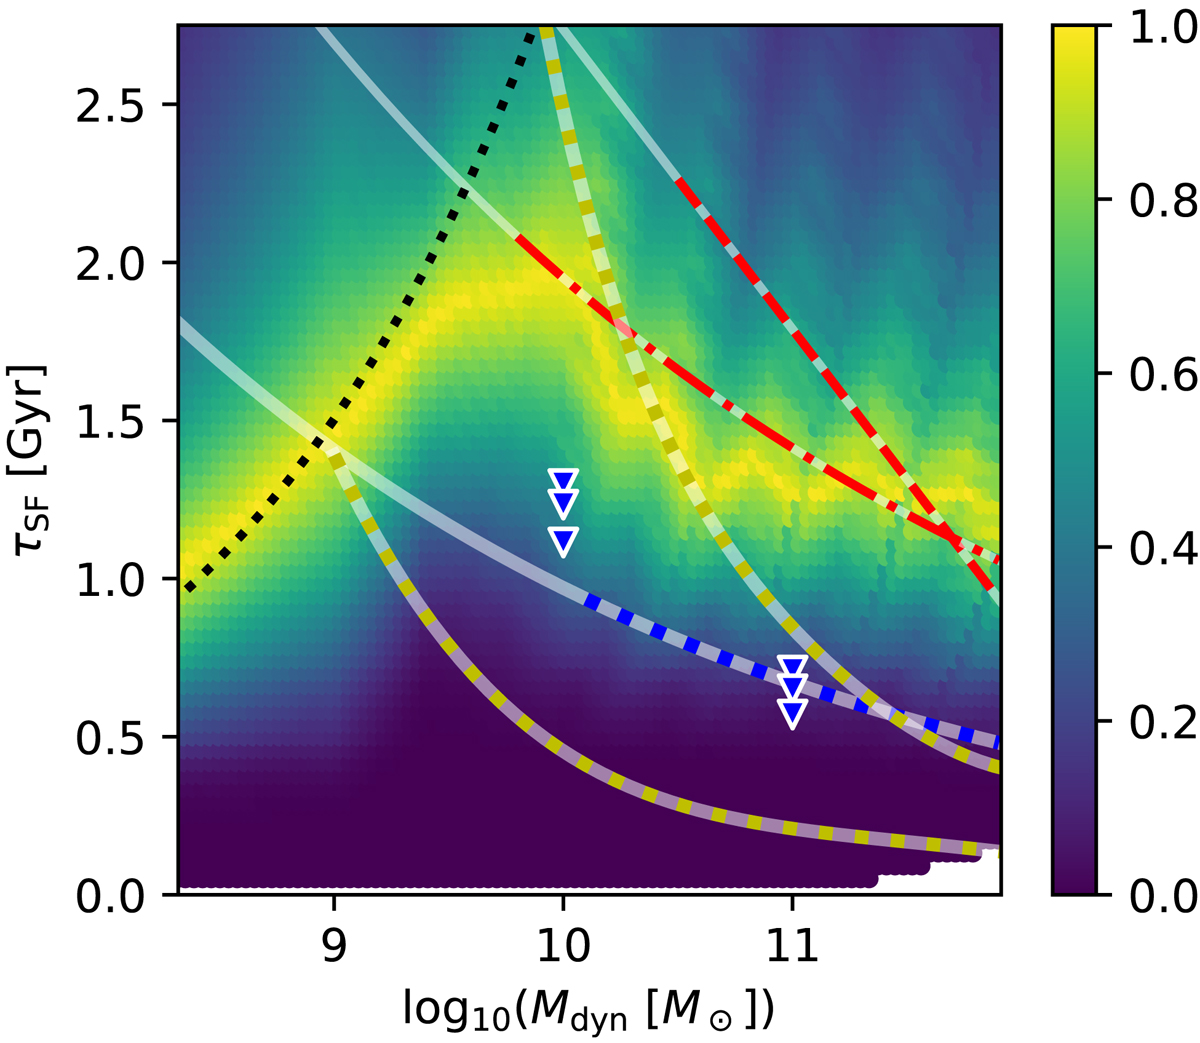
τSF as a function of Mdyn for the error function model. Same as Fig. 4, but the results shown by the colour map adopt the variable ![]() defined by Eq. (21) and shown by the solid curve in Fig. 5. The best-fit solutions (the yellow ridge line) for different Mdyn can be described by two relations, i.e., the black dotted curve (Eq. (18)) for Mdyn < 109.5 M⊙, and the red dash-dotted curve (Eq. (19)) for Mdyn > 109.8 M⊙.
defined by Eq. (21) and shown by the solid curve in Fig. 5. The best-fit solutions (the yellow ridge line) for different Mdyn can be described by two relations, i.e., the black dotted curve (Eq. (18)) for Mdyn < 109.5 M⊙, and the red dash-dotted curve (Eq. (19)) for Mdyn > 109.8 M⊙.
Current usage metrics show cumulative count of Article Views (full-text article views including HTML views, PDF and ePub downloads, according to the available data) and Abstracts Views on Vision4Press platform.
Data correspond to usage on the plateform after 2015. The current usage metrics is available 48-96 hours after online publication and is updated daily on week days.
Initial download of the metrics may take a while.