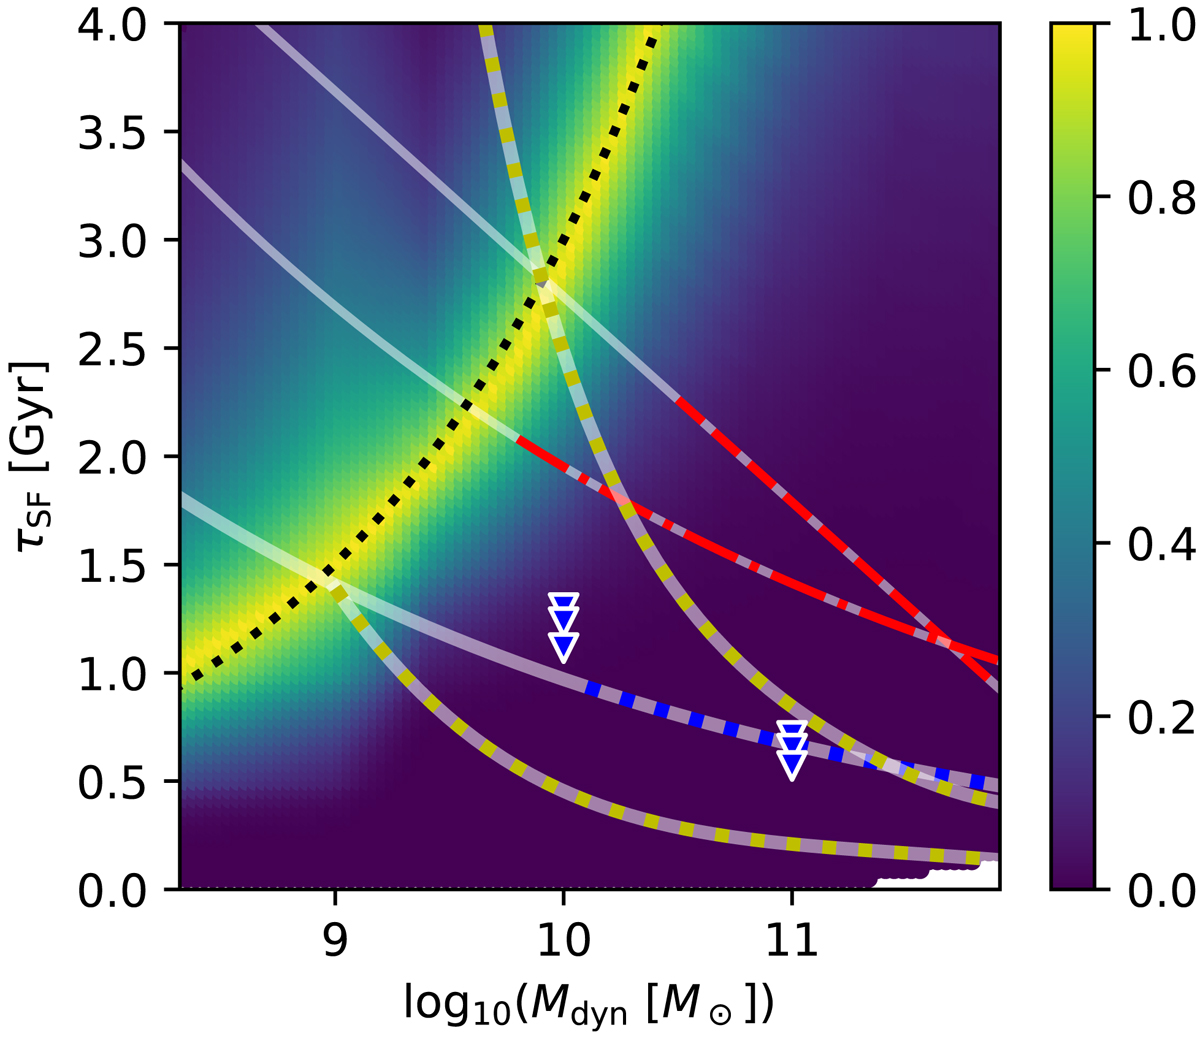
Fig. 4.
Download original image
τSF as a function of Mdyn. The colour bar indicates the goodness of the fit, p(gconv, τSF) (Eq. (17)), for our fiducial SNIa model. For a given mass and SFT, τSF, any star-to-gas-mass fraction, gconv, is allowed. The most likely SFT for a given galaxy mass is indicated by the yellow ridge line. The black dotted curve (Eq. (18)) is a power-law fit of the yellow ridge line. The red dashed curve and the red dash-dotted curve (Eq. (19)) represent the SFT constrained by SPS studies by de La Rosa et al. (2011) and McDermid et al. (2015), respectively. As is introduced in Sect. 1, The SFT suggested by chemical evolution studies assuming the invariant canonical gwIMF performed by Pipino & Matteucci (2004) and Thomas et al. (2005) are shown by the blue triangles and blue dotted curve, respectively. The lower and upper yellow dotted curves correspond, respectively, to polynomial regressions of the yellow ridge lines in Figs. 5 and 7 of Yan et al. (2019a), derived using invariant canonical gwIMF. The mass ranges of the coloured curves are limited by the mass ranges of the galaxy data sets they are based on.
Current usage metrics show cumulative count of Article Views (full-text article views including HTML views, PDF and ePub downloads, according to the available data) and Abstracts Views on Vision4Press platform.
Data correspond to usage on the plateform after 2015. The current usage metrics is available 48-96 hours after online publication and is updated daily on week days.
Initial download of the metrics may take a while.