Fig. 3.
Download original image
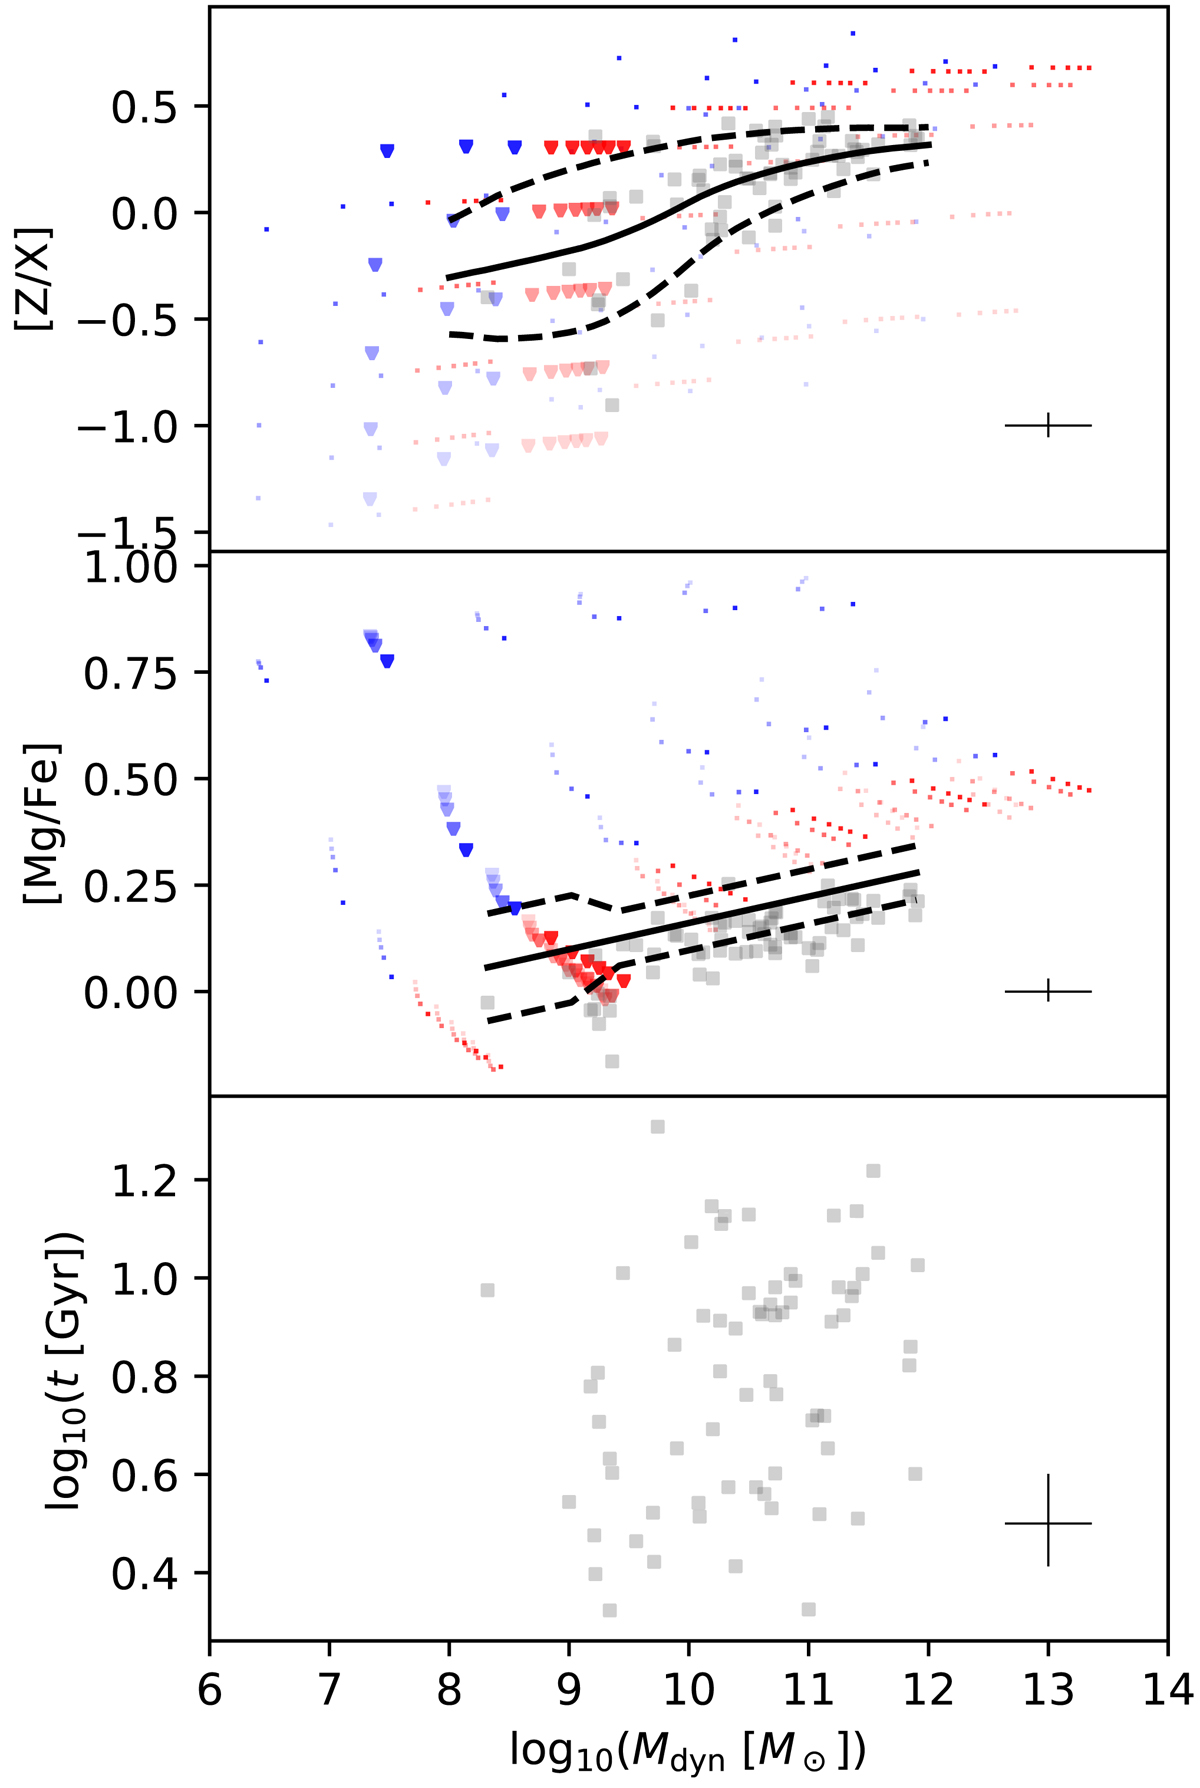
[Z/X], [Mg/Fe], and age of the E galaxies as a function of their dynamical masses. The grey circles are observed galaxies from Arrigoni et al. (2010), with the typical uncertainty shown at the lower right corner of each panel. The solid and dashed lines are, respectively, the mean and standard deviations of the observational constraints. The lines in the upper panel are given by Arrigoni et al. (2010) and smoothed by Yan et al. (2019a). The mean relation for the middle panel follows Thomas et al. (2005), while the standard deviation of the relation follows Liu et al. (2016). The points and triangles are the resulting Mdyn, [Z/X], and [Mg/Fe] values of our fiducial galaxy models adopting the IGIMF theory and a constant overall SNIa realisation parameter defined in Sect. 2.2. The triangles are models with ![]() while the points are models with other SFRs. The red and the blue dots are models with a SFT τSF ≥ 1 Gyr and τSF < 1 Gyr, respectively. The darker enhanced colours represent models with a higher gconv (defined in Sect. 4).
while the points are models with other SFRs. The red and the blue dots are models with a SFT τSF ≥ 1 Gyr and τSF < 1 Gyr, respectively. The darker enhanced colours represent models with a higher gconv (defined in Sect. 4).
Current usage metrics show cumulative count of Article Views (full-text article views including HTML views, PDF and ePub downloads, according to the available data) and Abstracts Views on Vision4Press platform.
Data correspond to usage on the plateform after 2015. The current usage metrics is available 48-96 hours after online publication and is updated daily on week days.
Initial download of the metrics may take a while.