Fig. 2.
Download original image
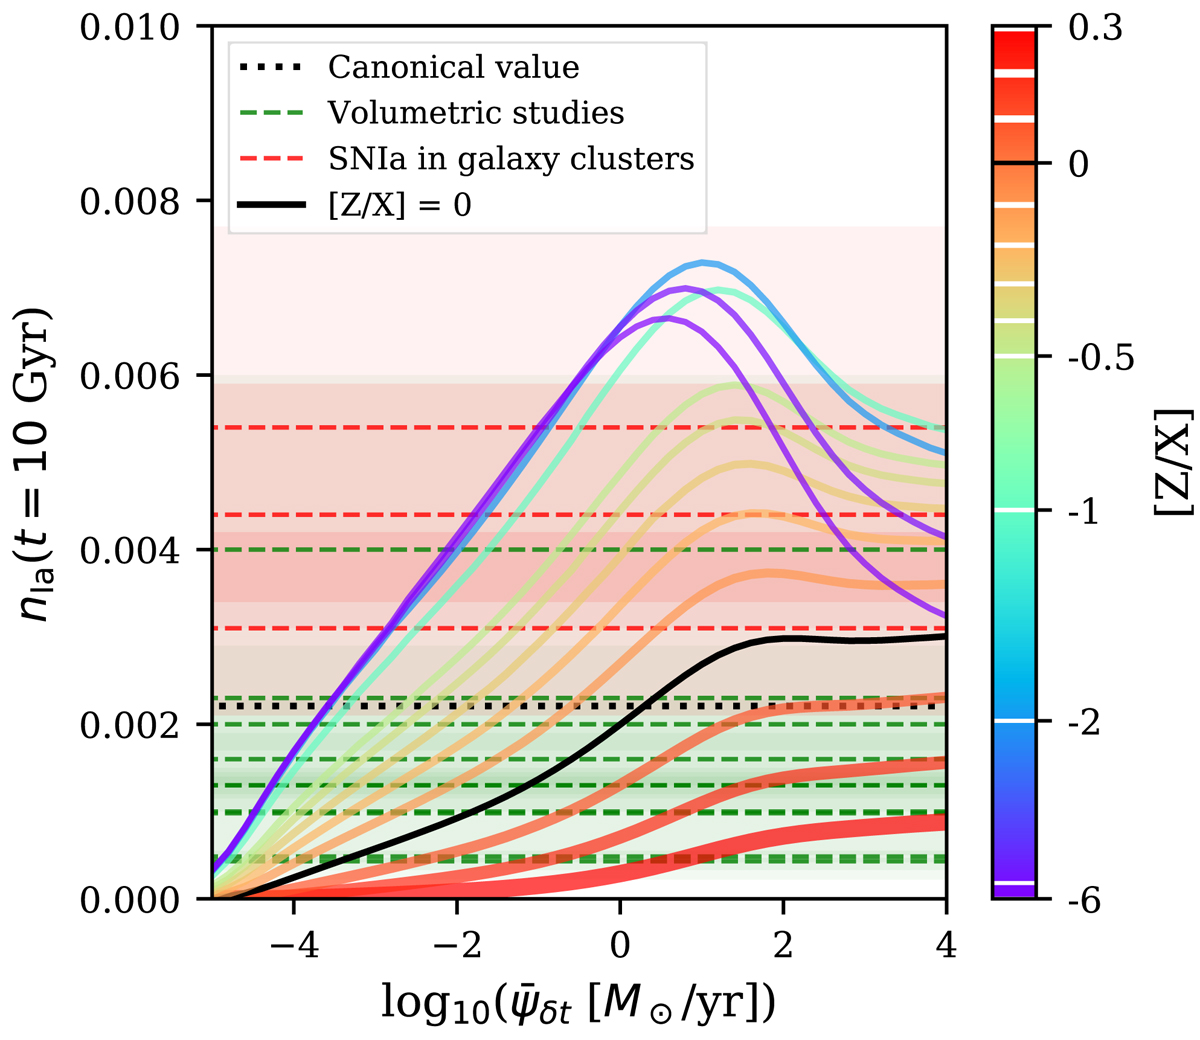
Ten Gyr time-integrated number of SNIa per unit stellar mass formed for the fiducial SNIa model calculated according to Eqs. (13)–(16). The fiducial SNIa model assumes a constant overall SNIa realisation parameter and the gwIMF as given by the IGIMF theory (Eq. (12)) as a function of the galaxy-wide SFR, ![]() , and metallicity, [Z/X]. The black line is the relation for [Z/X] = 0. Other lines with different colours represent different values of [Z/X], as indicated by the white stripes on the colour map on the right: [Z/X] = 0.3, 0.2, 0.1, −0.1, −0.2, −0.3, −0.4, −0.5, −1, −2, −4, and −6. The black horizontal dotted line represents the canonical nIa(t = 10 Gyr, ξcanonical) value of 0.0022/M⊙ (Maoz & Mannucci 2012). The green and red horizontal dashed lines indicate observational constraints on the nIa(t = 10 Gyr) for SNIa surveys up to a certain redshift and in galaxy clusters, respectively. The shaded regions represent the uncertainty ranges of the horizontal dashed lines. References are given in Table 1.
, and metallicity, [Z/X]. The black line is the relation for [Z/X] = 0. Other lines with different colours represent different values of [Z/X], as indicated by the white stripes on the colour map on the right: [Z/X] = 0.3, 0.2, 0.1, −0.1, −0.2, −0.3, −0.4, −0.5, −1, −2, −4, and −6. The black horizontal dotted line represents the canonical nIa(t = 10 Gyr, ξcanonical) value of 0.0022/M⊙ (Maoz & Mannucci 2012). The green and red horizontal dashed lines indicate observational constraints on the nIa(t = 10 Gyr) for SNIa surveys up to a certain redshift and in galaxy clusters, respectively. The shaded regions represent the uncertainty ranges of the horizontal dashed lines. References are given in Table 1.
Current usage metrics show cumulative count of Article Views (full-text article views including HTML views, PDF and ePub downloads, according to the available data) and Abstracts Views on Vision4Press platform.
Data correspond to usage on the plateform after 2015. The current usage metrics is available 48-96 hours after online publication and is updated daily on week days.
Initial download of the metrics may take a while.