Fig. 11.
Download original image
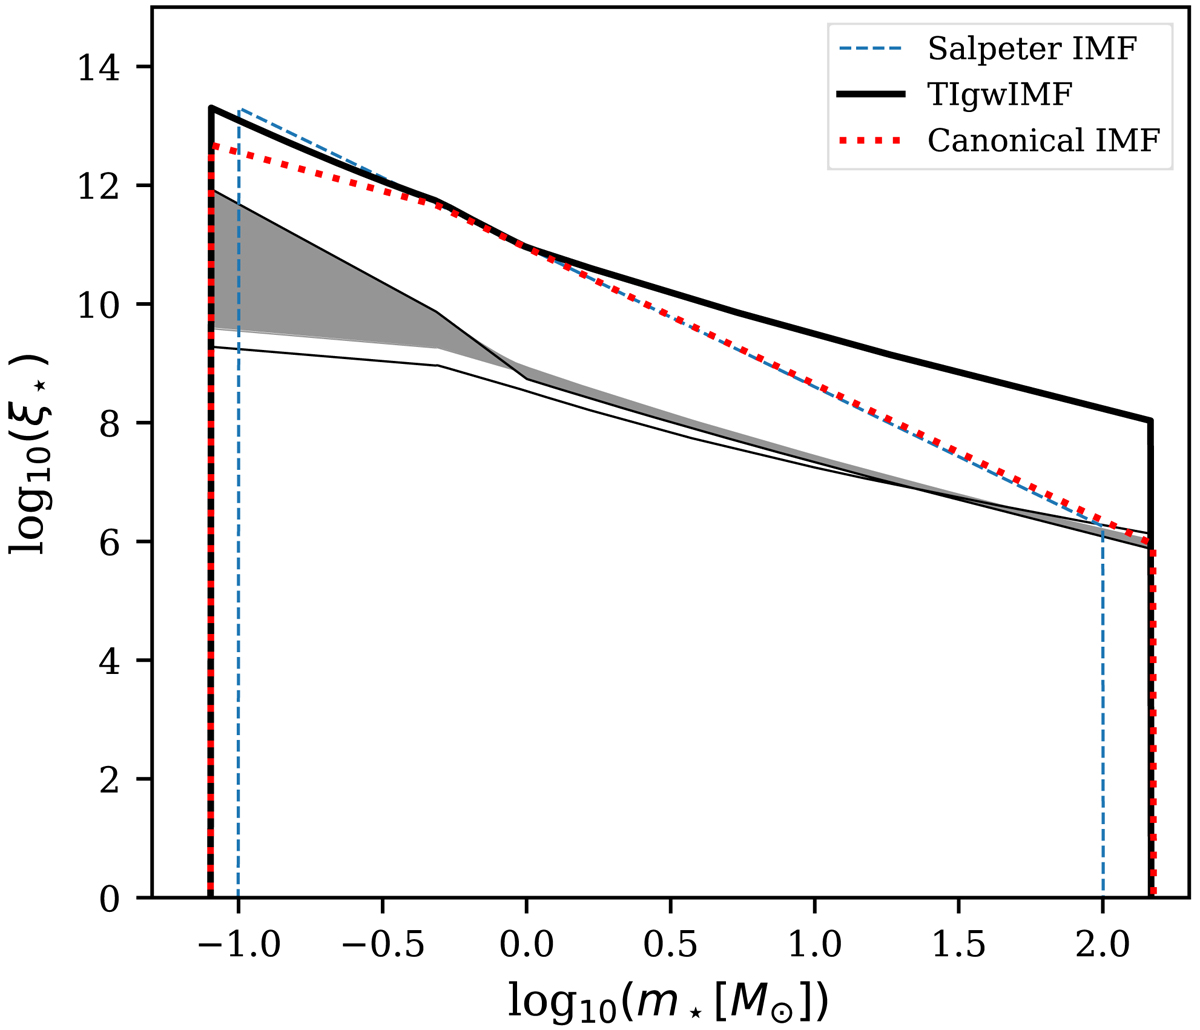
gwIMF, as defined in Eq. (12), of each 10 Myr star formation epoch (thin lines) and the time-integrated gwIMF for all formation epochs (TIgwIMF) for a galaxy with a final mass of Mdyn = 1011.9 M⊙. This TIgwIMF corresponds to the red model in Fig. 10. The corresponding approximating simple-population IGIMF model is shown in Fig. 9 as a red line. The gwIMF for the first and the last star formation epochs are highlighted by slightly thicker lines. The canonical IMF as given by Kroupa (2001) and the power-law IMF given by Salpeter (1955) are shown via the red dotted and blue dashed lines, respectively.
Current usage metrics show cumulative count of Article Views (full-text article views including HTML views, PDF and ePub downloads, according to the available data) and Abstracts Views on Vision4Press platform.
Data correspond to usage on the plateform after 2015. The current usage metrics is available 48-96 hours after online publication and is updated daily on week days.
Initial download of the metrics may take a while.