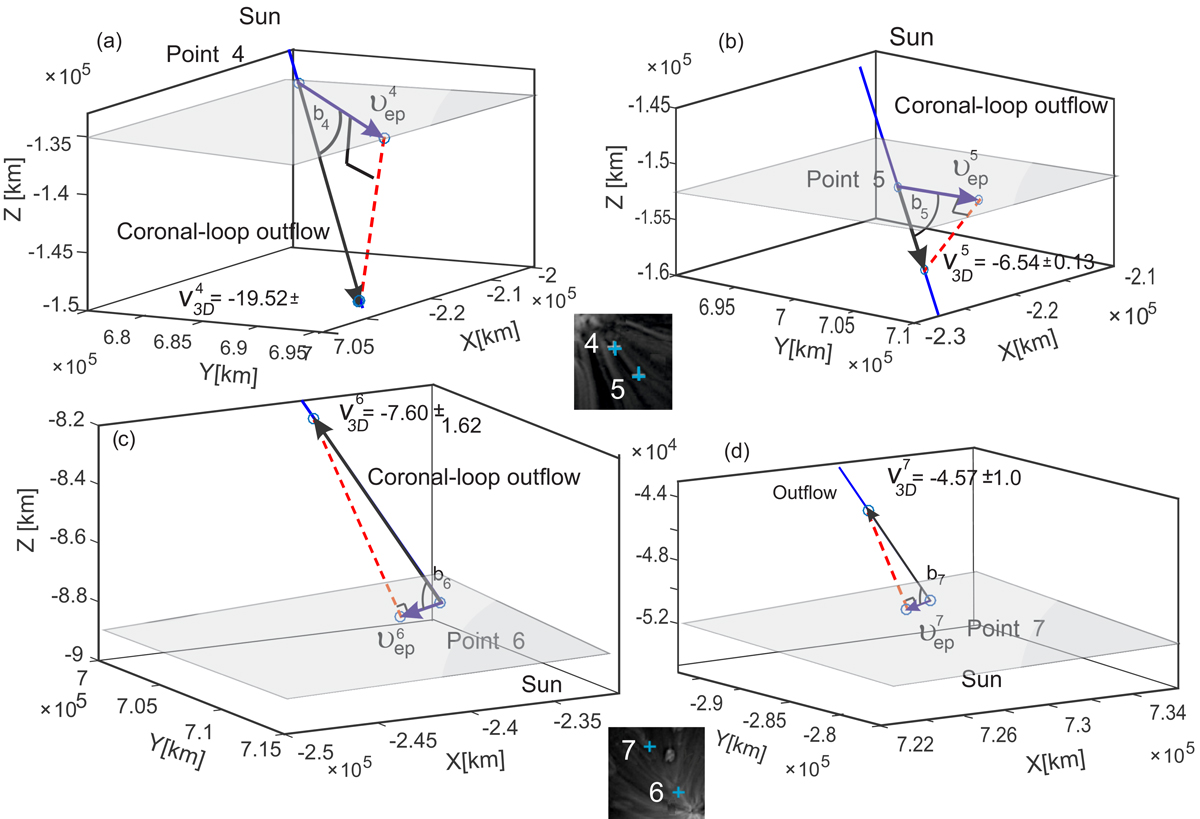
Fig. 9.
Download original image
Open loops traced in 3D solar coronal coordinates at points 4, 5 (panels a and b) and 6, 7 (panels c and d). The grey planes represent epipolar planes crossing the loops at the points under observation. The epipolar planes are formed in the heliosphere by the two spacecraft locations and each of the points 4, 5, 6, and 7; vep is reconstructed in the plane as shown in Fig. 8. The V3D velocity vectors are reconstructed using the measured angle β and vep according to Eq. (1). The magnitudes of the vectors are shown in Table 2.
Current usage metrics show cumulative count of Article Views (full-text article views including HTML views, PDF and ePub downloads, according to the available data) and Abstracts Views on Vision4Press platform.
Data correspond to usage on the plateform after 2015. The current usage metrics is available 48-96 hours after online publication and is updated daily on week days.
Initial download of the metrics may take a while.