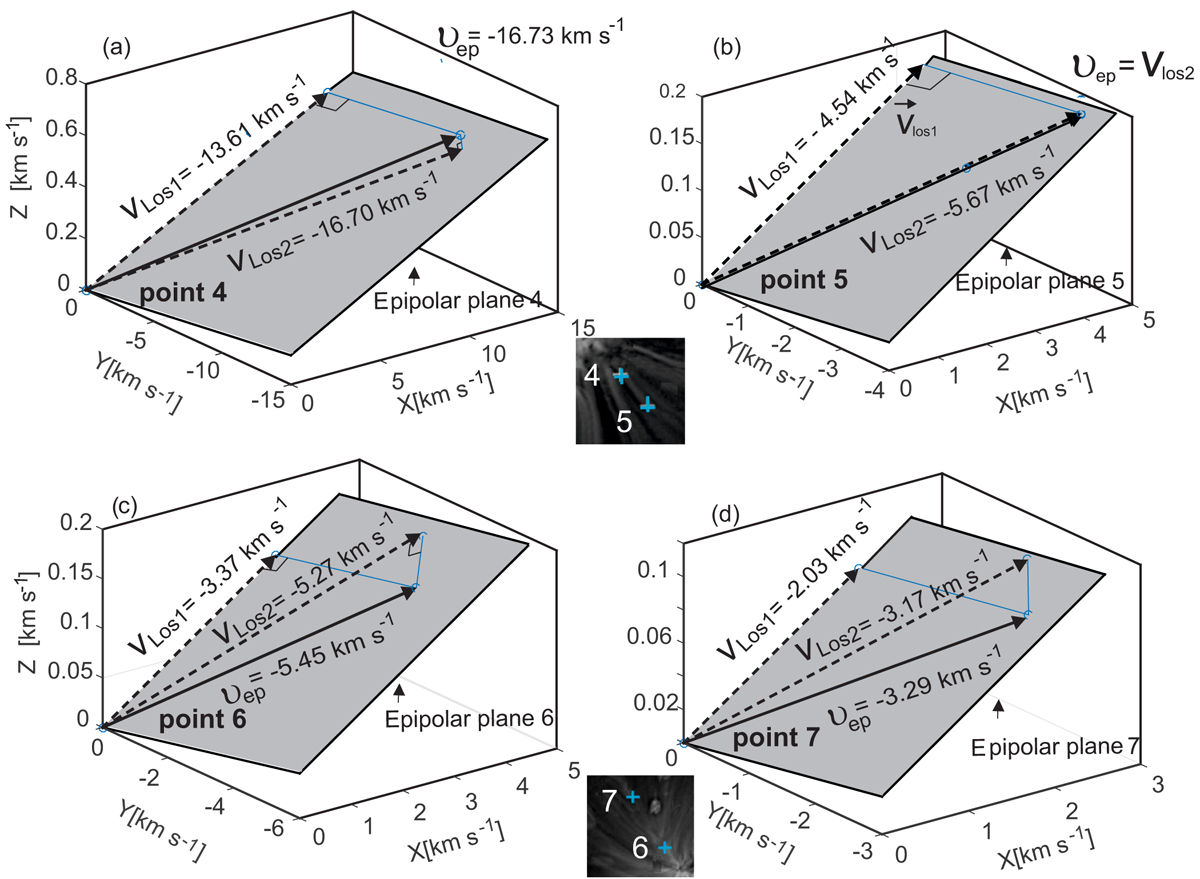
Fig. 8.
Download original image
Two LOS velocity components vLOS1 and vLOS2 (dashed arrows), measured by each spectrometer at points 4, 5, 6, and 7 in the corona and the reconstructed vep (solid arrows) in the epipolar plane (grey). The epipolar plane is defined by the locations of the two spacecraft and the point in the solar corona to be triangulated. vep represents the projection of V3D on the epipolar plane. When projected on LOS1 and LOS2, vep represents the velocities vLOS1 and vLOS2 measured by each spectrometer.
Current usage metrics show cumulative count of Article Views (full-text article views including HTML views, PDF and ePub downloads, according to the available data) and Abstracts Views on Vision4Press platform.
Data correspond to usage on the plateform after 2015. The current usage metrics is available 48-96 hours after online publication and is updated daily on week days.
Initial download of the metrics may take a while.