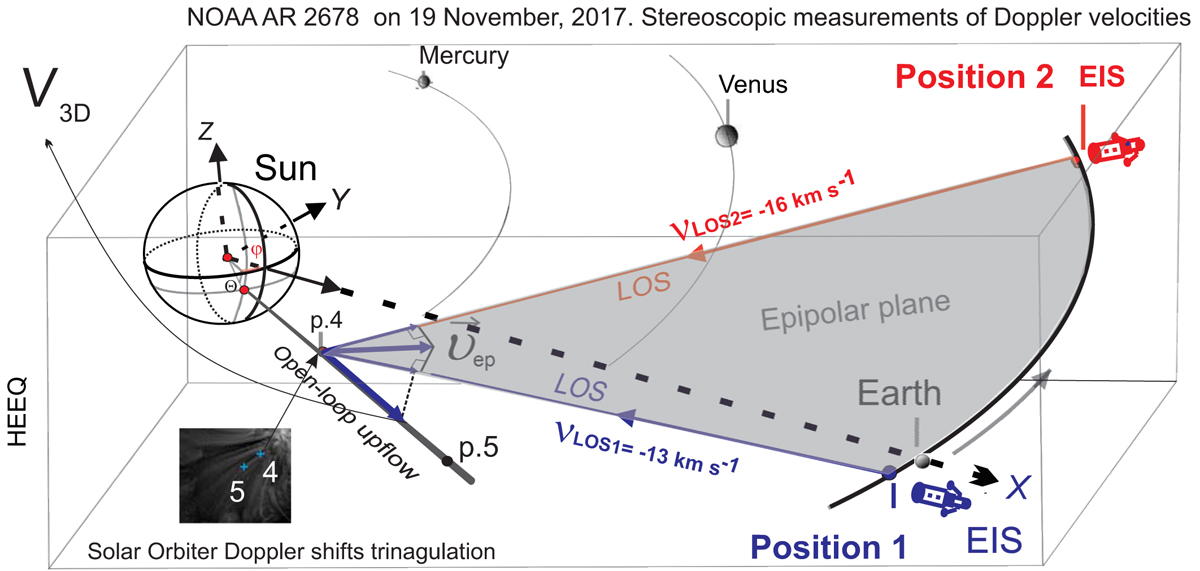
Fig. 7.
Download original image
Stereoscopic observation of NOAA AR 2678 on 19 November 2017, shown in the 3D HEEQ coordinate system. The X-axis is directed towards the Earth and the Z-axis is aligned with the solar rotation axis passing through the solar north. The two observing satellites are separated from each other by 37°. The blue-shifts at point 4 are measured along their respective LOSs and are represented by the vector magnitudes vLOS1 and vLOS2. The velocity vector vep, measured in the epipolar plane, is calculated from vLOS1 and vLOS2 following the geometry depicted in the figure. In this case the true velocity vector of point 4 is directed along the coronal loop, showing the plasma flow confined by the magnetic field, and it is calculated directly from the deprojection of V3D on the coronal loop. If the plasma flow is perpendicular to the epipolar plane, its velocity cannot be measured, i.e. V3D cannot be derived when it makes an angle of 90° degrees with the epipolar plane.
Current usage metrics show cumulative count of Article Views (full-text article views including HTML views, PDF and ePub downloads, according to the available data) and Abstracts Views on Vision4Press platform.
Data correspond to usage on the plateform after 2015. The current usage metrics is available 48-96 hours after online publication and is updated daily on week days.
Initial download of the metrics may take a while.