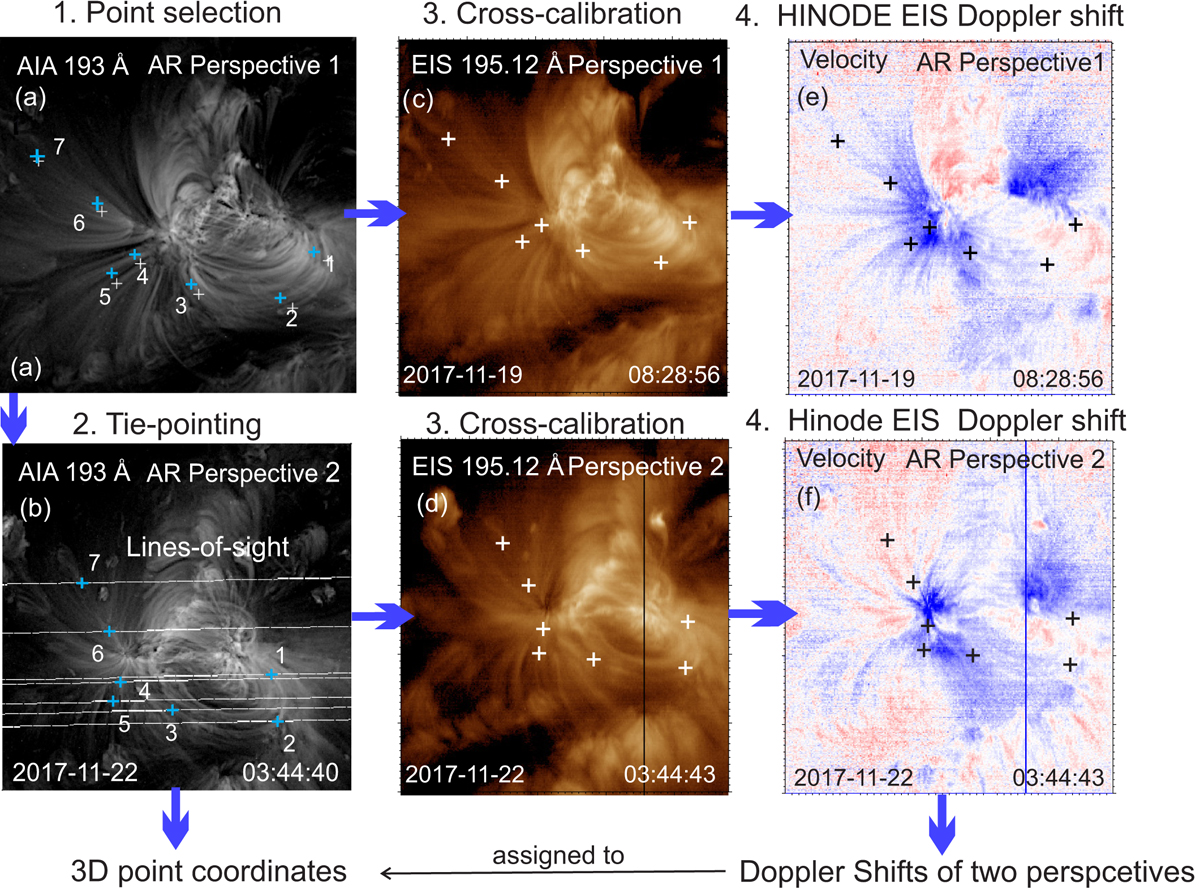
Fig. 6.
Download original image
Stereoscopic view of NOAA AR 2678, recorded from different perspectives in November 2017. (a) and (b) show the elevated 3D points projected on the 2D SDO/AIA intensity maps through the LOS technique. LOS1 from Perspective 1 (panel a) is projected downwards in Image 2 (panel b). Crosses denote the projection of the elevated coronal points in 2D images. Cross-calibration has been applied for the SDO/AIA and Hinode/EIS images (panels c and d). The Hinode/EIS intensity and Doppler velocity maps match, as long as they are obtained by the same spectrometer at the same time. The LOS projections of the elevated points on the 2D Doppler velocity maps (panels e and f) provide two LOS velocity values attached to their reference point in 3D space. The majority of the reconstructed points are associated with upflows (blue) and only two points are associated with downflows (red).
Current usage metrics show cumulative count of Article Views (full-text article views including HTML views, PDF and ePub downloads, according to the available data) and Abstracts Views on Vision4Press platform.
Data correspond to usage on the plateform after 2015. The current usage metrics is available 48-96 hours after online publication and is updated daily on week days.
Initial download of the metrics may take a while.