Free Access
Fig. 2.
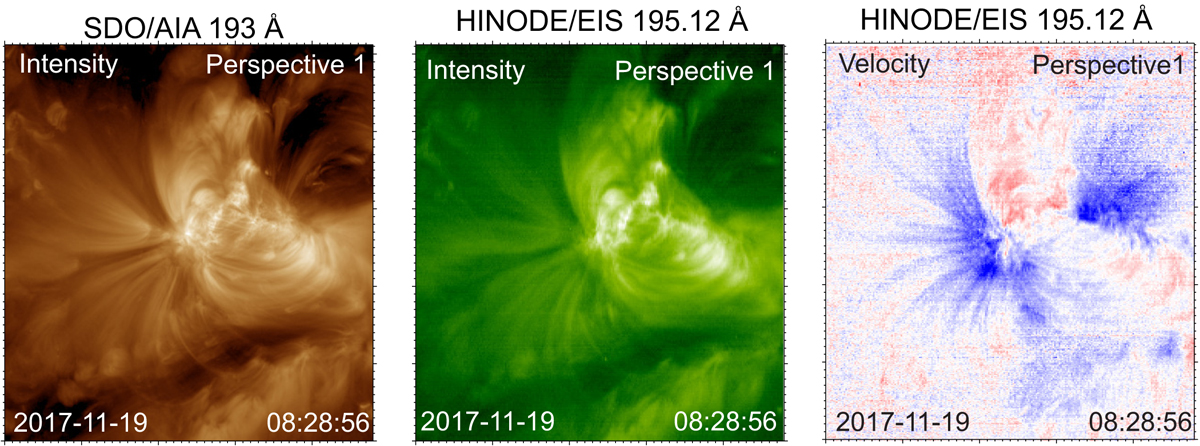
Download original image
Hinode/EIS intensity (middle) and Doppler velocity (right) raster maps with corrected pointing information, and the spatio-temporally corresponding artificial SDO/AIA raster map (left) obtained by the instruments in position 1.
Current usage metrics show cumulative count of Article Views (full-text article views including HTML views, PDF and ePub downloads, according to the available data) and Abstracts Views on Vision4Press platform.
Data correspond to usage on the plateform after 2015. The current usage metrics is available 48-96 hours after online publication and is updated daily on week days.
Initial download of the metrics may take a while.