Free Access
Fig. 11.
Download original image
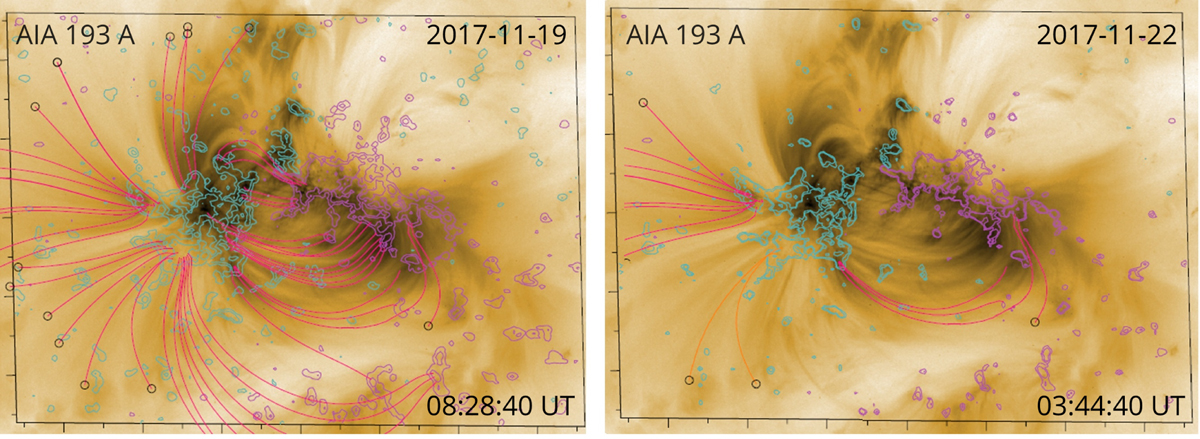
LFFF extrapolation for NOAA AR 2678 overlaid on an SDO/AIA intensity map. Left panel: LFFF model results at 08:28 UT on 19 November 2017. Right panel: LFFF model extrapolation at 03:44 UT on 22 November 2017.
Current usage metrics show cumulative count of Article Views (full-text article views including HTML views, PDF and ePub downloads, according to the available data) and Abstracts Views on Vision4Press platform.
Data correspond to usage on the plateform after 2015. The current usage metrics is available 48-96 hours after online publication and is updated daily on week days.
Initial download of the metrics may take a while.