Fig. 10.
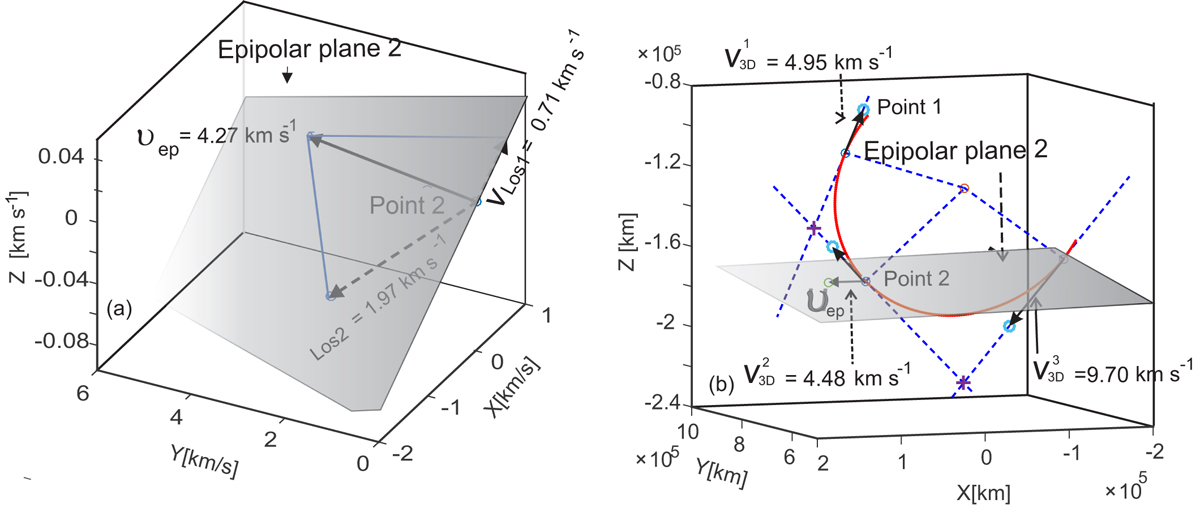
Download original image
Plasma flow velocity vectors in the 3D closed coronal loop under investigation. The location of the loop points in the high corona and the 3D geometry of the loop were determined using the LOS projection technique. Panel a: velocity vector vep, deprojected from the two Doppler LOS velocities measured by the two spectrometers at point 2. The epipolar plane (grey) is the plane containing the two satellites and the observation point. The vectors V3D were constructed by the deprojection of vep on the tangent to the loop direction (panel b). The absolute values of the vectors are shown in Table 3.
Current usage metrics show cumulative count of Article Views (full-text article views including HTML views, PDF and ePub downloads, according to the available data) and Abstracts Views on Vision4Press platform.
Data correspond to usage on the plateform after 2015. The current usage metrics is available 48-96 hours after online publication and is updated daily on week days.
Initial download of the metrics may take a while.