Fig. 1.
Download original image
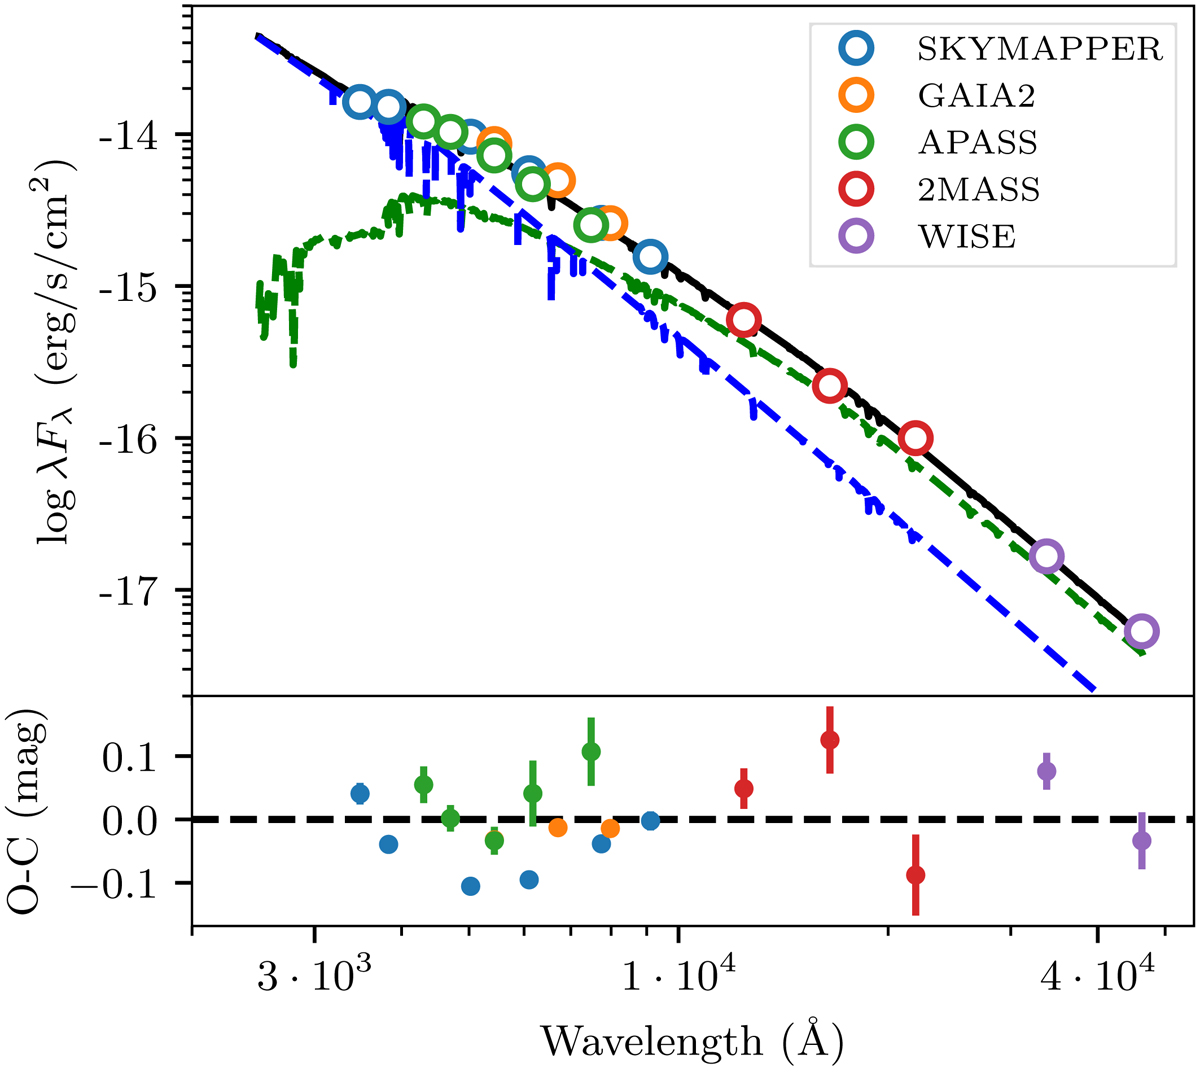
Photometric SED of J22564–5910 obtained from literature photometry. The best-fitting model is shown with solid black line, with the contribution of the sdB shown with a blue-dashed line. The contribution of the IR excess, likely from a disc, is shown with a green-dashed line. The bottom shows the O–C between the observations and the best fitting model.
Current usage metrics show cumulative count of Article Views (full-text article views including HTML views, PDF and ePub downloads, according to the available data) and Abstracts Views on Vision4Press platform.
Data correspond to usage on the plateform after 2015. The current usage metrics is available 48-96 hours after online publication and is updated daily on week days.
Initial download of the metrics may take a while.