Free Access
Fig. 9.
Download original image
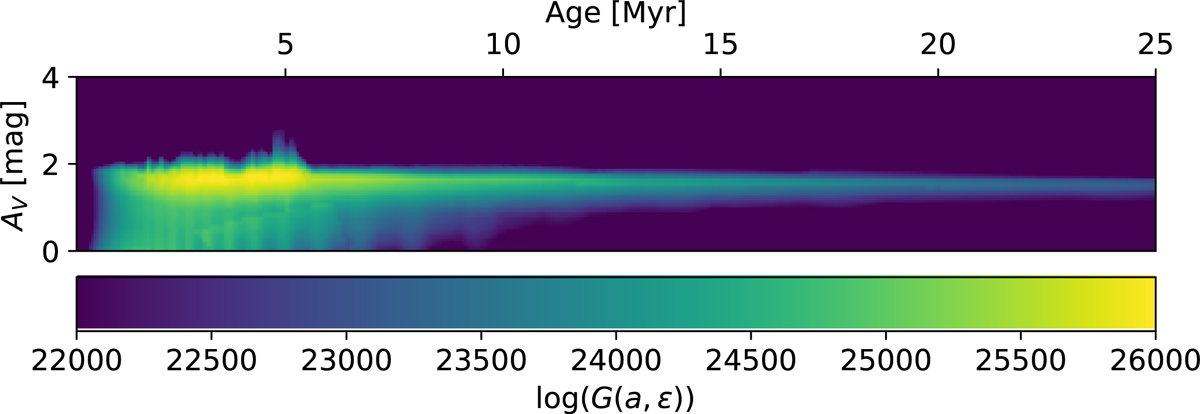
G-function distribution in age and extinction based on the PARSEC isochrones for the whole sample. The likelihood is shown with a color scale indicated with the bar at the bottom of the figure. The best fit in this case is the isochrone of 4.7 Myr with an AV of 1.7 (see also Fig. 11).
Current usage metrics show cumulative count of Article Views (full-text article views including HTML views, PDF and ePub downloads, according to the available data) and Abstracts Views on Vision4Press platform.
Data correspond to usage on the plateform after 2015. The current usage metrics is available 48-96 hours after online publication and is updated daily on week days.
Initial download of the metrics may take a while.