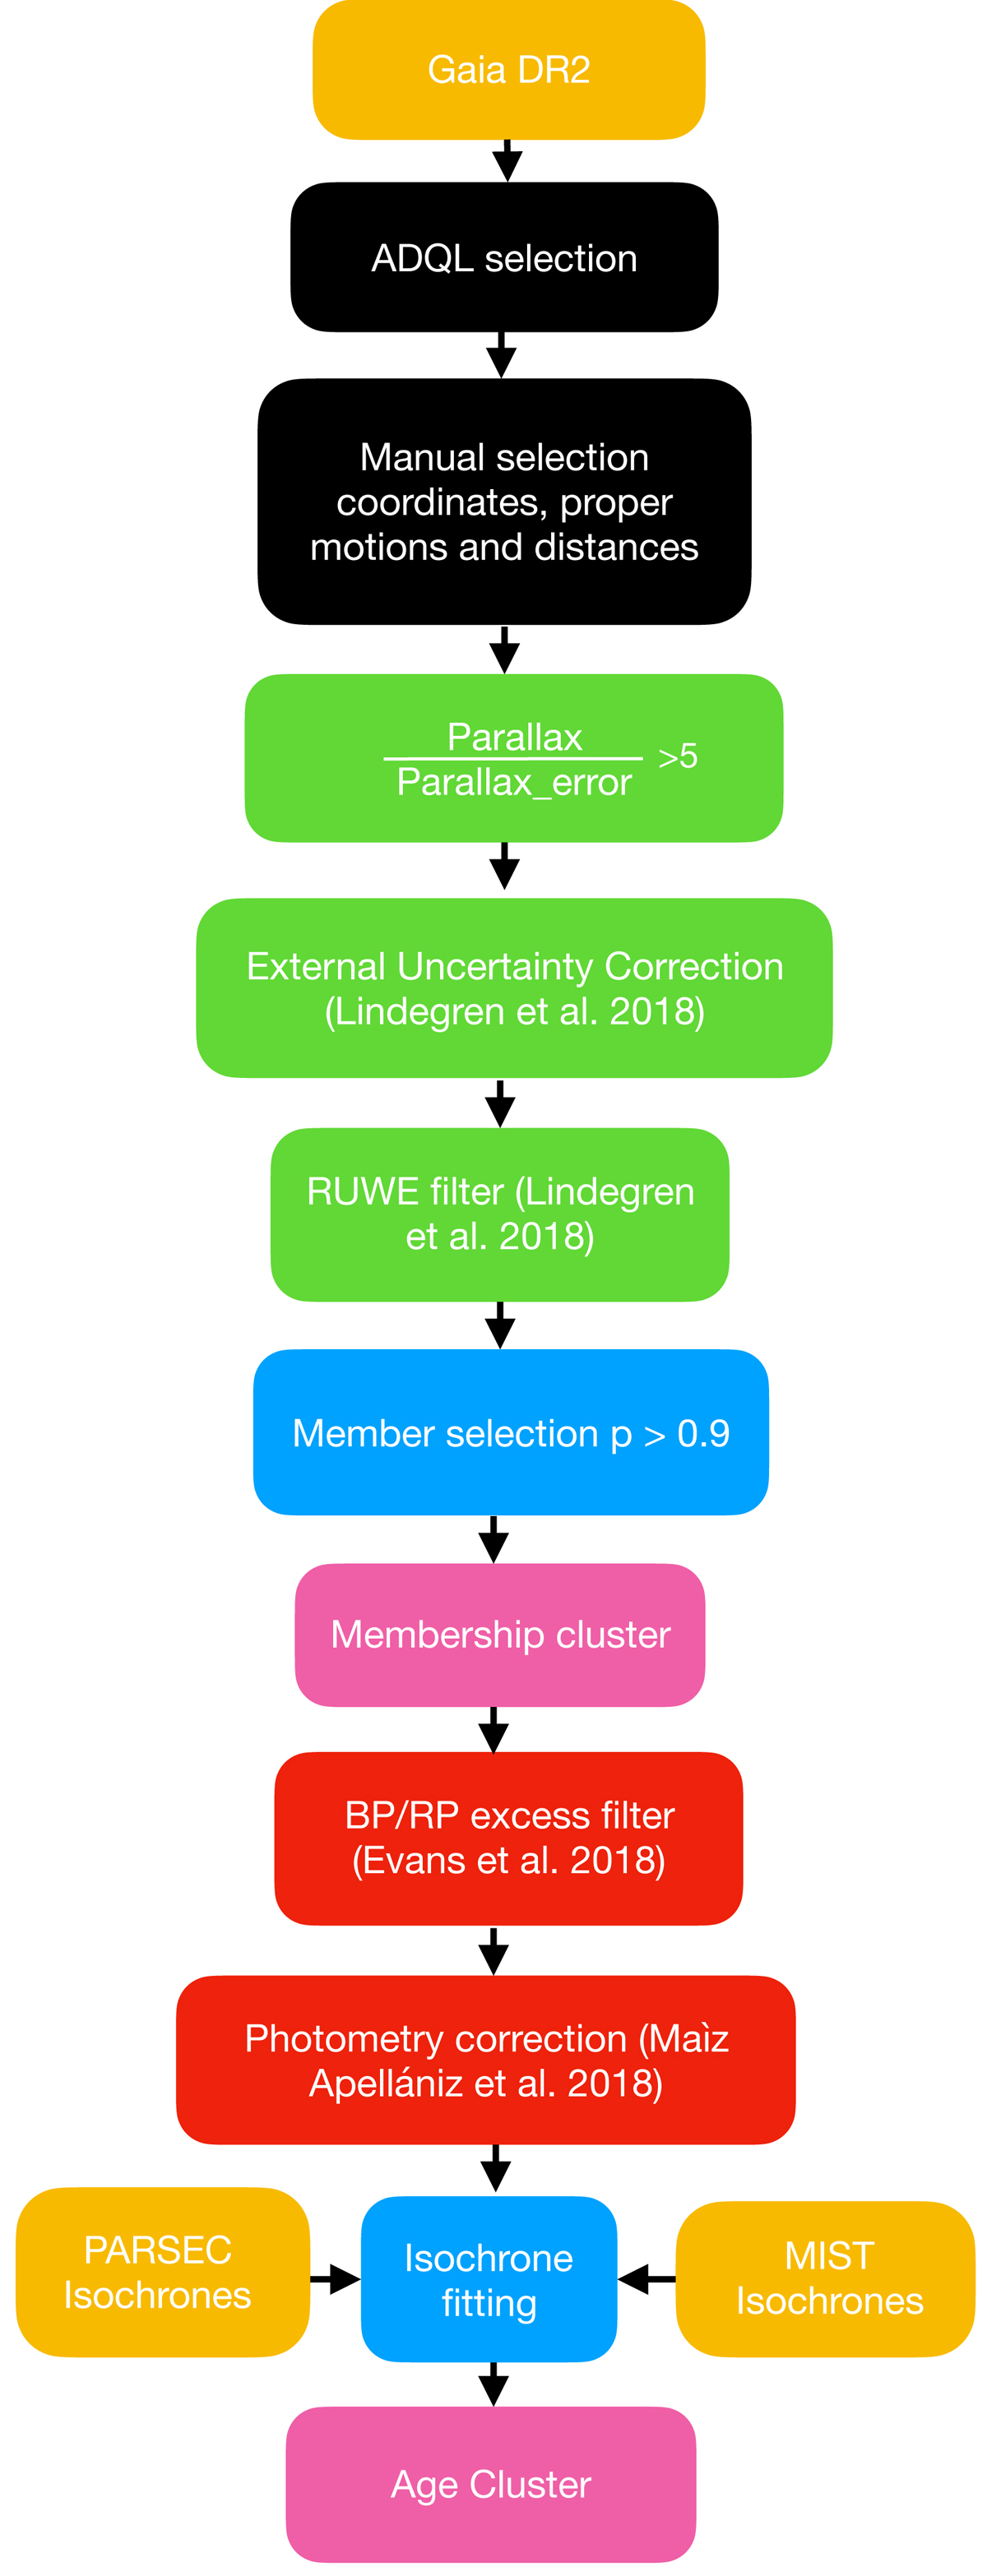
Fig. 2.
Download original image
Flowchart showing the scripts that are used to get from the data to the results: yellow blocks refer to data; black blocks represent the applied manual selection criteria; green blocks indicate where astrometric corrections have been applied; red blocks represent the occurrence of photometric corrections; blue blocks signal the pipelines that are used to select the data and pink blocks represent the results.
Current usage metrics show cumulative count of Article Views (full-text article views including HTML views, PDF and ePub downloads, according to the available data) and Abstracts Views on Vision4Press platform.
Data correspond to usage on the plateform after 2015. The current usage metrics is available 48-96 hours after online publication and is updated daily on week days.
Initial download of the metrics may take a while.