Free Access
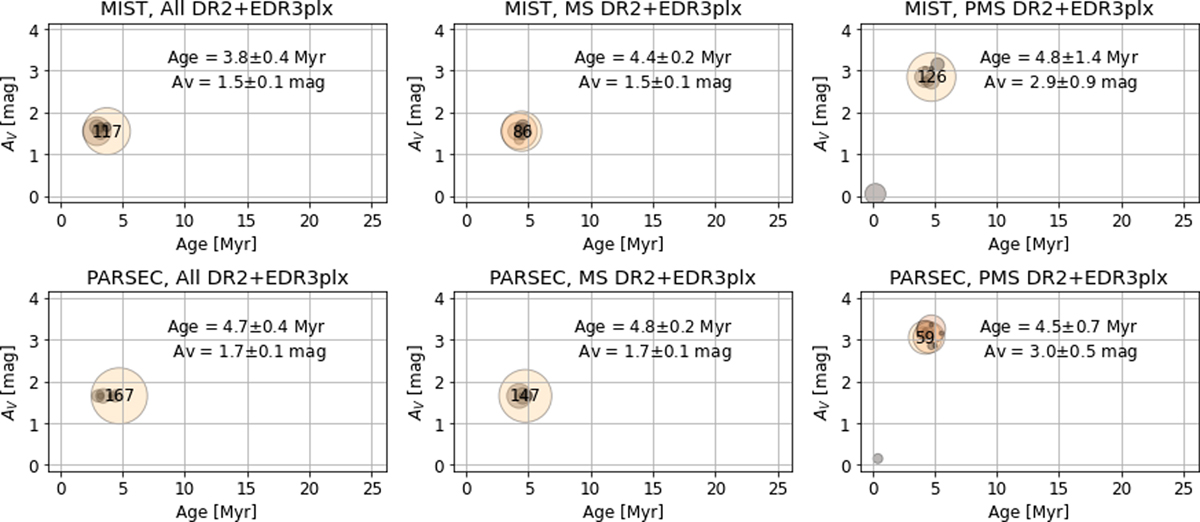
Fig. 12.
Download original image
Distribution of solutions based on the bootstrap method. The location of the circle represents the age and extinction of the best fit isochrone, and the size of the cirle is proportional to the occurrence rate based on the 200 trials.
Current usage metrics show cumulative count of Article Views (full-text article views including HTML views, PDF and ePub downloads, according to the available data) and Abstracts Views on Vision4Press platform.
Data correspond to usage on the plateform after 2015. The current usage metrics is available 48-96 hours after online publication and is updated daily on week days.
Initial download of the metrics may take a while.