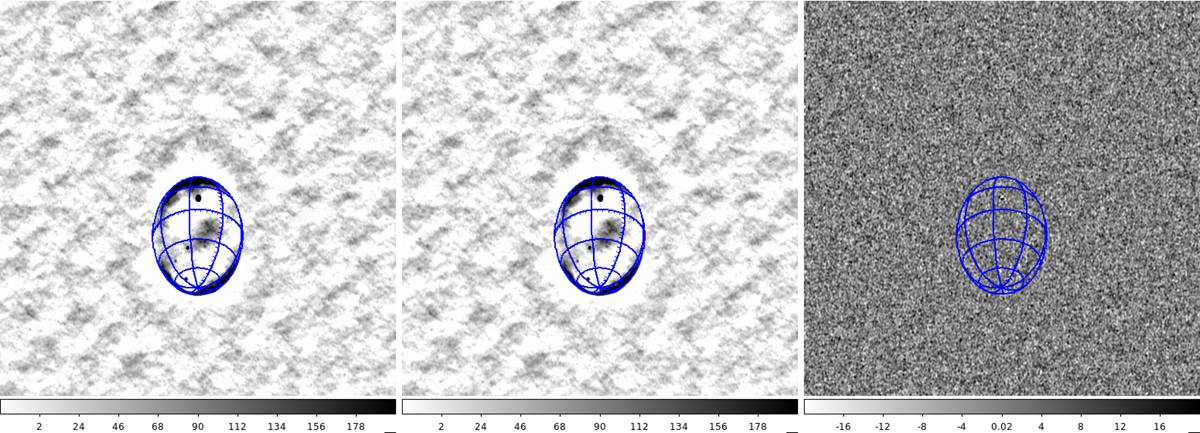
Fig. 19.
Download original image
Maps for linear polarisation X at 199.2 MHz from the solar observation on 2018 April 26 (Sect. 6), shown in the native slant orthographic projection of the snapshots. Time step one is the left panel, and the middle panel is time step two. Subtracting the left panel from the middle panel gives the difference map shown in the right panel (we note the different colour bar scales; the colour bar has been deliberately set to show low-level signal vs. the ∼50 000 Jy Sun). The Sun is the point source at the centre of both the left and middle panels; after difference imaging, positive and negative residuals remain at the position of the Sun, but only at the 0.05% level in this particular case. CLEANing was restricted to a small box surrounding the Sun (see Sect. 6.2). The difference image is clearly noise-like, illustrating the effectiveness of this technique.
Current usage metrics show cumulative count of Article Views (full-text article views including HTML views, PDF and ePub downloads, according to the available data) and Abstracts Views on Vision4Press platform.
Data correspond to usage on the plateform after 2015. The current usage metrics is available 48-96 hours after online publication and is updated daily on week days.
Initial download of the metrics may take a while.