Fig. 18.
Download original image
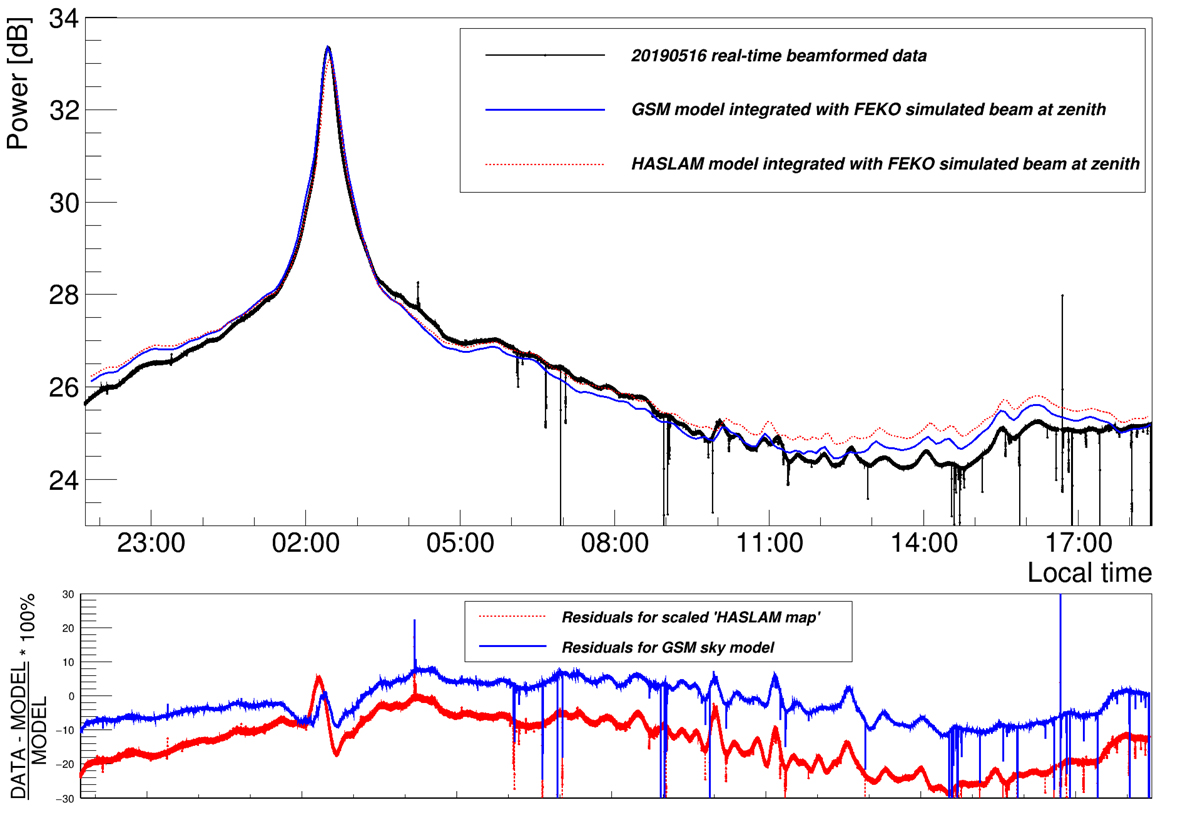
Total power in decibel-kelvin scale (calculated as 10 log10(Tsys)) of the AAVS1 station beam at zenith at 159.375 MHz, as a function of local time (top image). The black curve is the data points from the AAVS1 real-time station beam. The solid blue curve is the model prediction using the GSM and the dashed red curve is the prediction using the HASLAM map scaled to our observing frequencies using a spectral index of −2.5. Both predictions incorporate a model of the AAVS1 station beam pointed at zenith. The lower plot shows the difference between the data and simulated curve using GSM sky model (maximum difference ≈15%) and scaled HASLAM map (maximum difference ≈20%). The vertical spikes are due to RFI or lost packets, which used to occasionally happen when there were other processes running on the AAVS1 server during the data acquisition.
Current usage metrics show cumulative count of Article Views (full-text article views including HTML views, PDF and ePub downloads, according to the available data) and Abstracts Views on Vision4Press platform.
Data correspond to usage on the plateform after 2015. The current usage metrics is available 48-96 hours after online publication and is updated daily on week days.
Initial download of the metrics may take a while.