Fig. 15.
Download original image
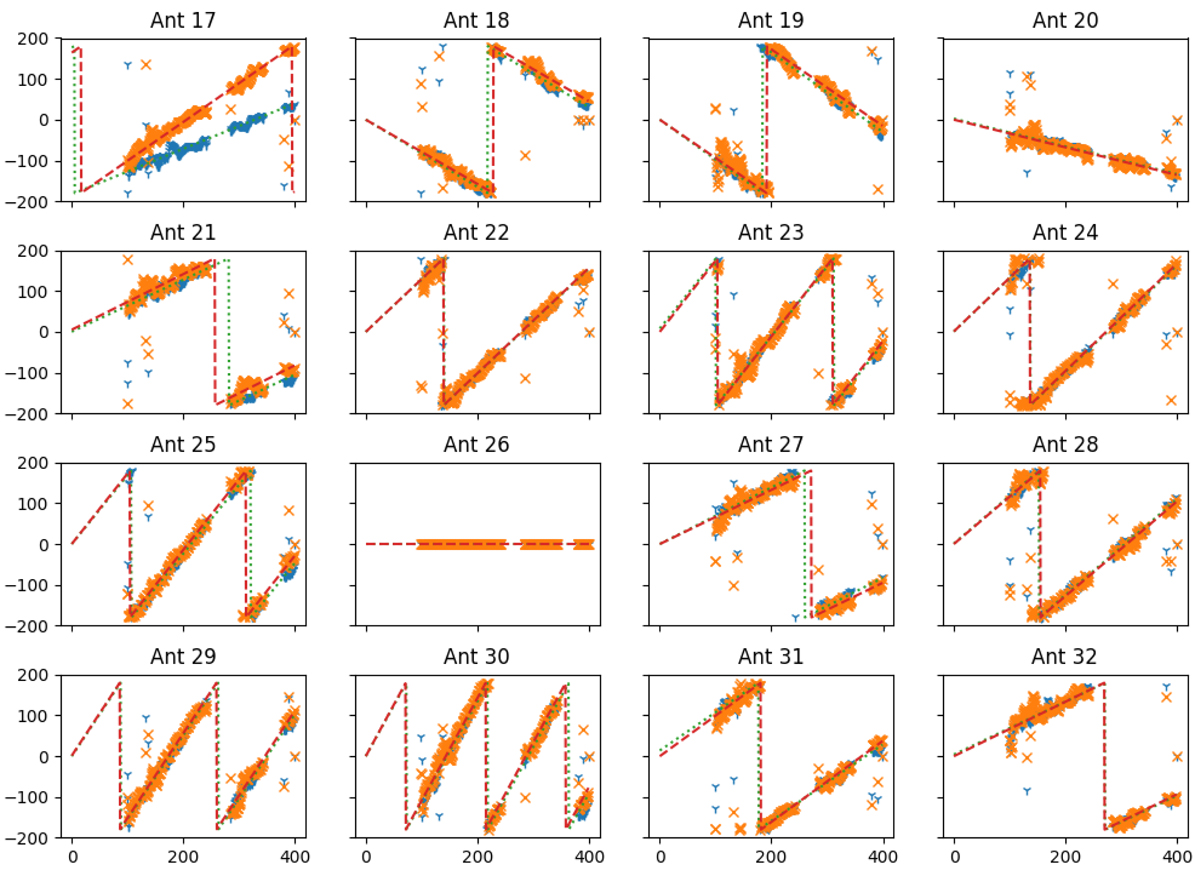
Example antenna-based phase calibration solution over a broad range of frequencies. Antenna 26 was offline. Data below 100 MHz and in frequency bands known to be affected by persistent RFI have been excluded. Individual points are shown for the two polarisations (orange ‘X’ and blue ‘Y’) as well as the predicted phase from a fitted delay for each polarisation, shown by the dot or dashed red and green lines.
Current usage metrics show cumulative count of Article Views (full-text article views including HTML views, PDF and ePub downloads, according to the available data) and Abstracts Views on Vision4Press platform.
Data correspond to usage on the plateform after 2015. The current usage metrics is available 48-96 hours after online publication and is updated daily on week days.
Initial download of the metrics may take a while.