Fig. 14.
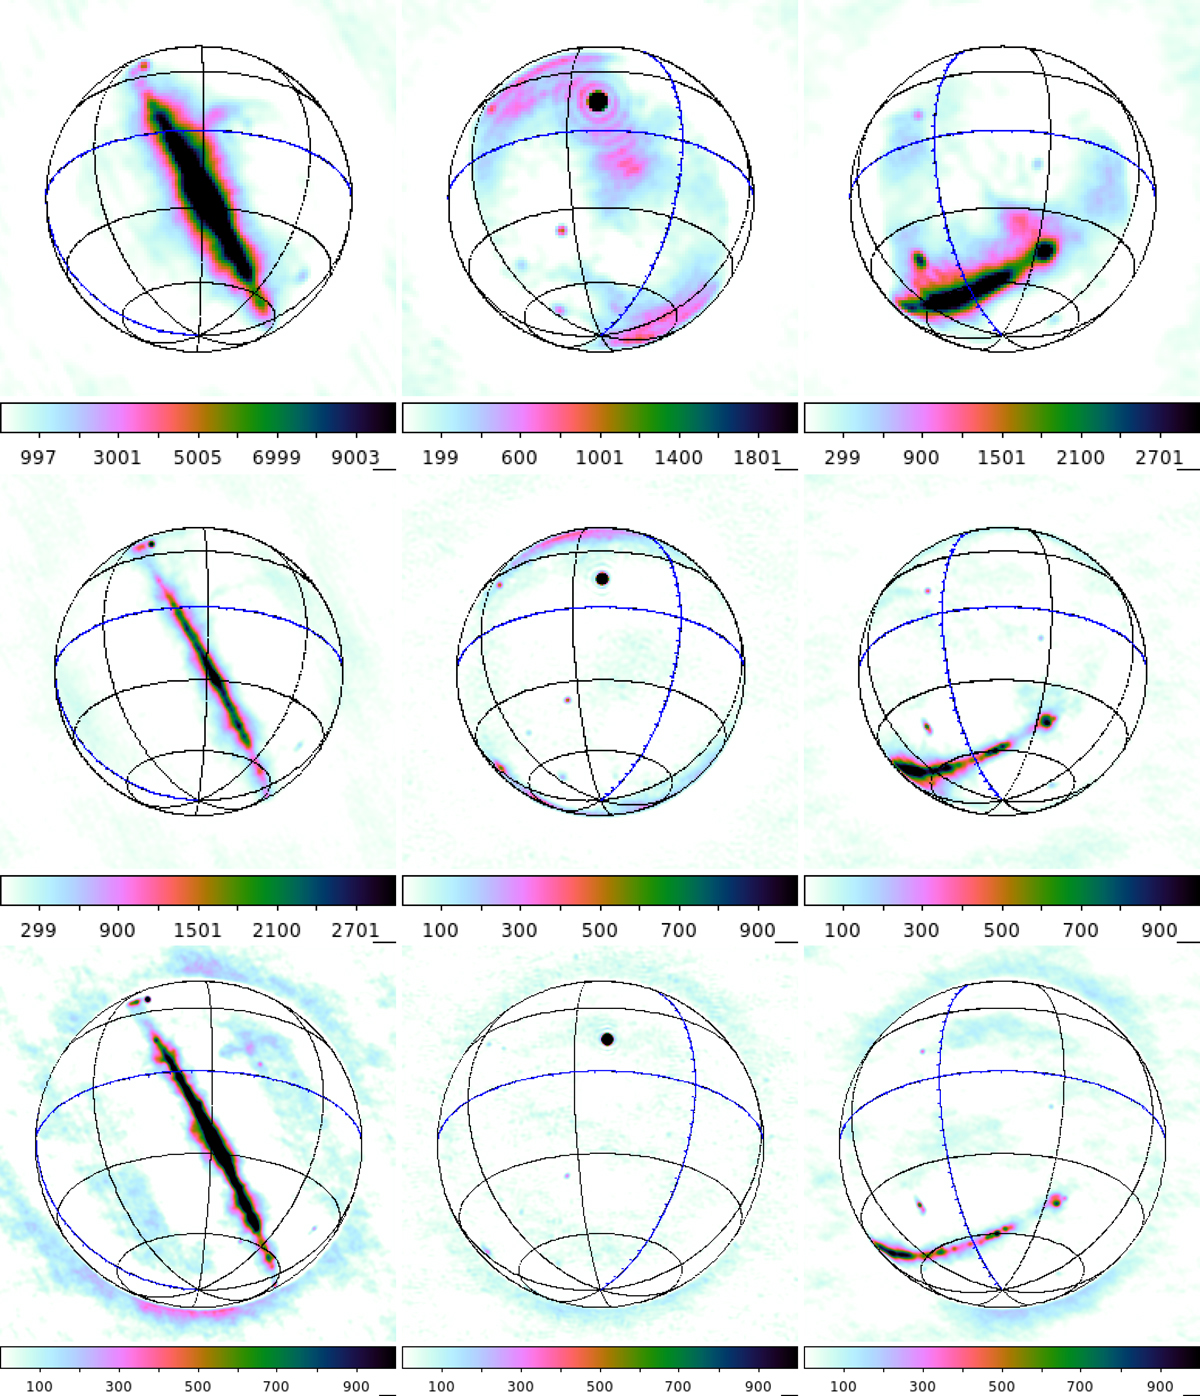
Download original image
Example sky images made from 2.3 s snapshots of data taken on 2018 April 26. Rows show frequencies 105, 200 and 308 MHz (from top to bottom). Columns show LSTs approximately 18, 2 and 10 h (from left to right). The bright source in the central column images is the Sun, which was used as a phase and flux density calibrator. The flux scale is Jy beam−1 normalised at zenith, but the images have not been primary-beam corrected, hence they show beam-weighted apparent flux density of the sky in the snapshots, i.e. what the array saw. Note the colourbars are not all the same, and the scale has been set to highlight weaker sources and the general very high dynamic range of the snapshots, while stronger sources are saturated.
Current usage metrics show cumulative count of Article Views (full-text article views including HTML views, PDF and ePub downloads, according to the available data) and Abstracts Views on Vision4Press platform.
Data correspond to usage on the plateform after 2015. The current usage metrics is available 48-96 hours after online publication and is updated daily on week days.
Initial download of the metrics may take a while.