Fig. 8.
Download original image
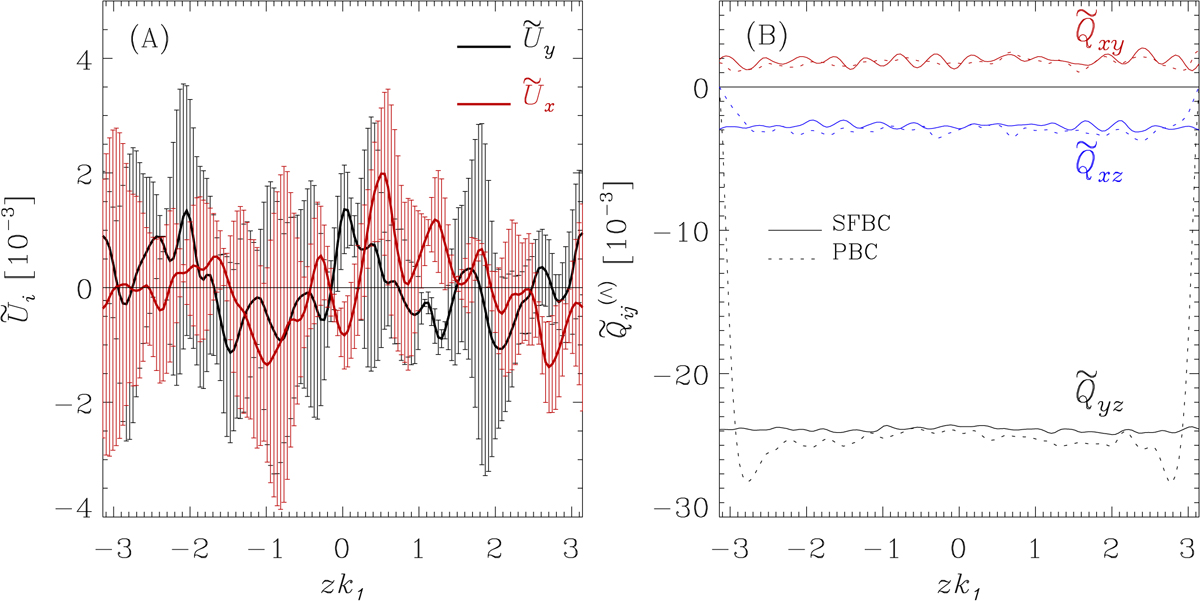
Panel A: time-averaged normalized mean velocity vs. vertical direction of the PBC run for set C46 at a latitude of 30°. The black and red lines show ![]() and
and ![]() , respectively. Panel B: comparison of the time-averaged normalized stresses obtained from periodic and stress-free boundary condition of the same run. The solid and dashed lines show the measured
, respectively. Panel B: comparison of the time-averaged normalized stresses obtained from periodic and stress-free boundary condition of the same run. The solid and dashed lines show the measured ![]() (red),
(red), ![]() (blue) and
(blue) and ![]() (black) from SFBC and PBC runs, respectively.
(black) from SFBC and PBC runs, respectively.
Current usage metrics show cumulative count of Article Views (full-text article views including HTML views, PDF and ePub downloads, according to the available data) and Abstracts Views on Vision4Press platform.
Data correspond to usage on the plateform after 2015. The current usage metrics is available 48-96 hours after online publication and is updated daily on week days.
Initial download of the metrics may take a while.