Fig. 7.
Download original image
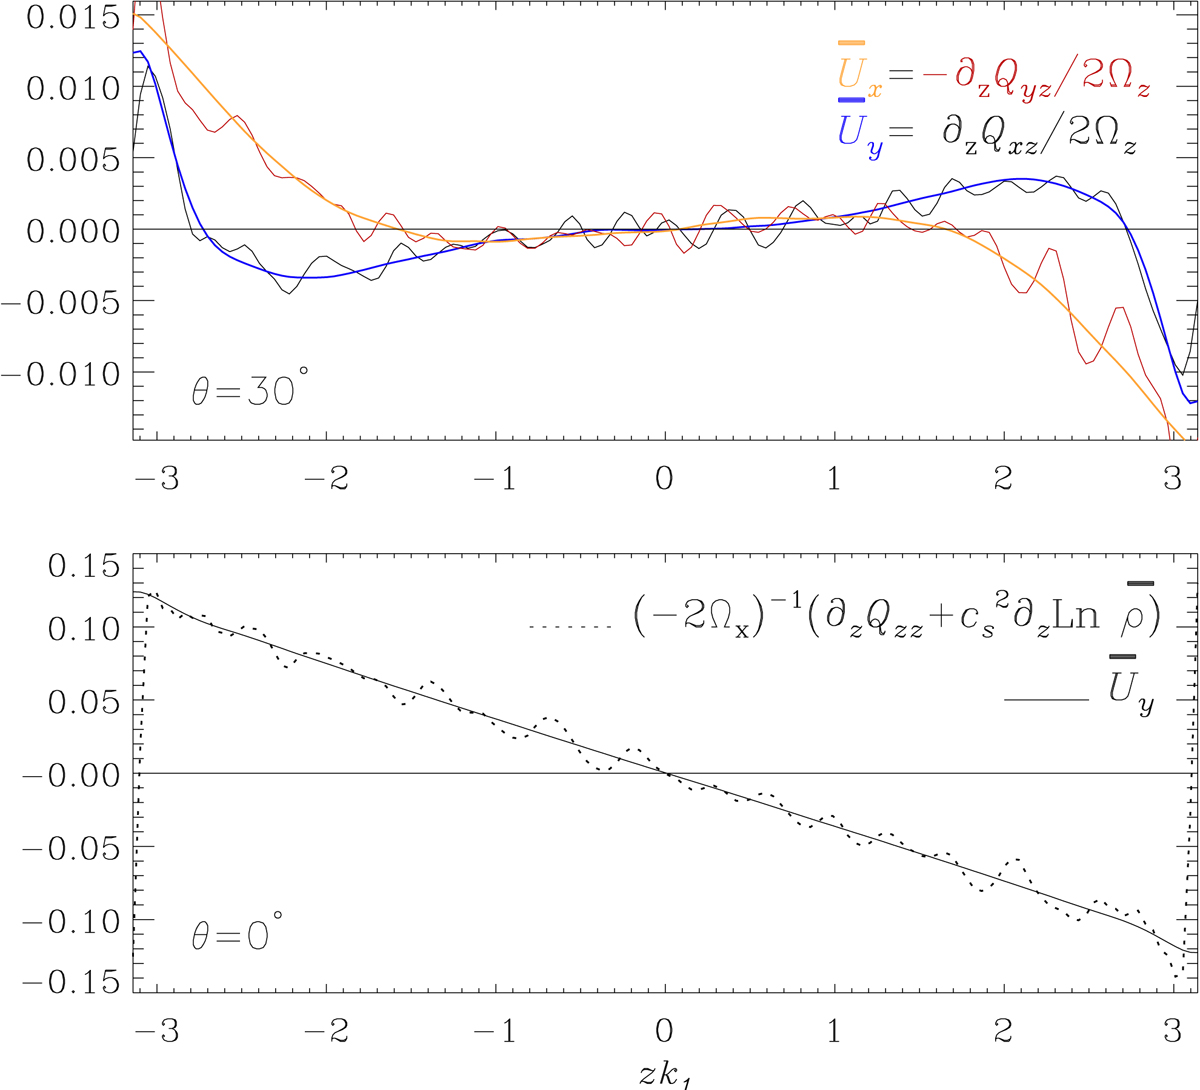
Time-averaged mean velocities ![]() and
and ![]() and their corresponding balancing terms in Eqs. (27) and (28) at latitude of 30° (upper panel) and Eq. (30) at the equator (lower panel) in the vertical direction for set C46. In the upper panel, the orange and blue lines show
and their corresponding balancing terms in Eqs. (27) and (28) at latitude of 30° (upper panel) and Eq. (30) at the equator (lower panel) in the vertical direction for set C46. In the upper panel, the orange and blue lines show ![]() and
and ![]() , respectively. The red and black lines show the RHS of Eqs. (28) and (27), respectively. In the lower panel, the solid and dotted lines show the LHS and RHS of Eq. (30), respectively.
, respectively. The red and black lines show the RHS of Eqs. (28) and (27), respectively. In the lower panel, the solid and dotted lines show the LHS and RHS of Eq. (30), respectively.
Current usage metrics show cumulative count of Article Views (full-text article views including HTML views, PDF and ePub downloads, according to the available data) and Abstracts Views on Vision4Press platform.
Data correspond to usage on the plateform after 2015. The current usage metrics is available 48-96 hours after online publication and is updated daily on week days.
Initial download of the metrics may take a while.