Open Access
Fig. 6.
Download original image
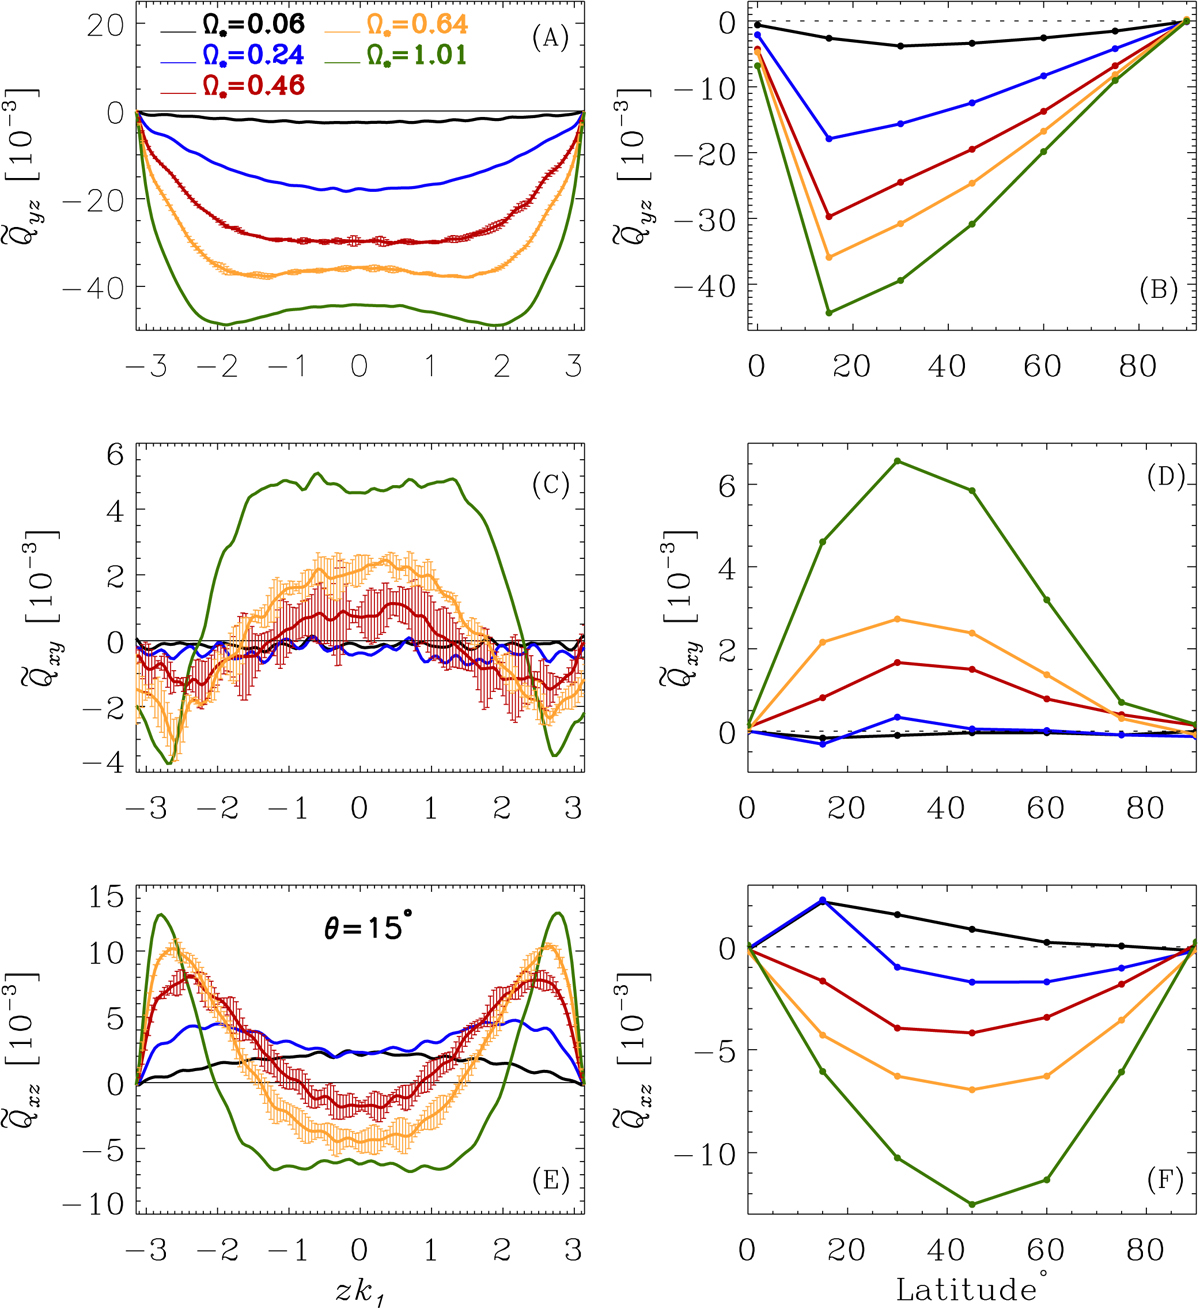
Left column: time-averaged off-diagonal Reynolds stresses vs. vertical direction at five selected Ω⋆ indicated by the legend at a latitude of 15°. Right column: stresses shown in the left panels, further spatially averaged (−0.5 ≤ zk1 ≤ 0.5), at different latitudes. The rows from top to bottom show ![]() ,
, ![]() , and
, and ![]() .
.
Current usage metrics show cumulative count of Article Views (full-text article views including HTML views, PDF and ePub downloads, according to the available data) and Abstracts Views on Vision4Press platform.
Data correspond to usage on the plateform after 2015. The current usage metrics is available 48-96 hours after online publication and is updated daily on week days.
Initial download of the metrics may take a while.