Open Access
Fig. 5.
Download original image
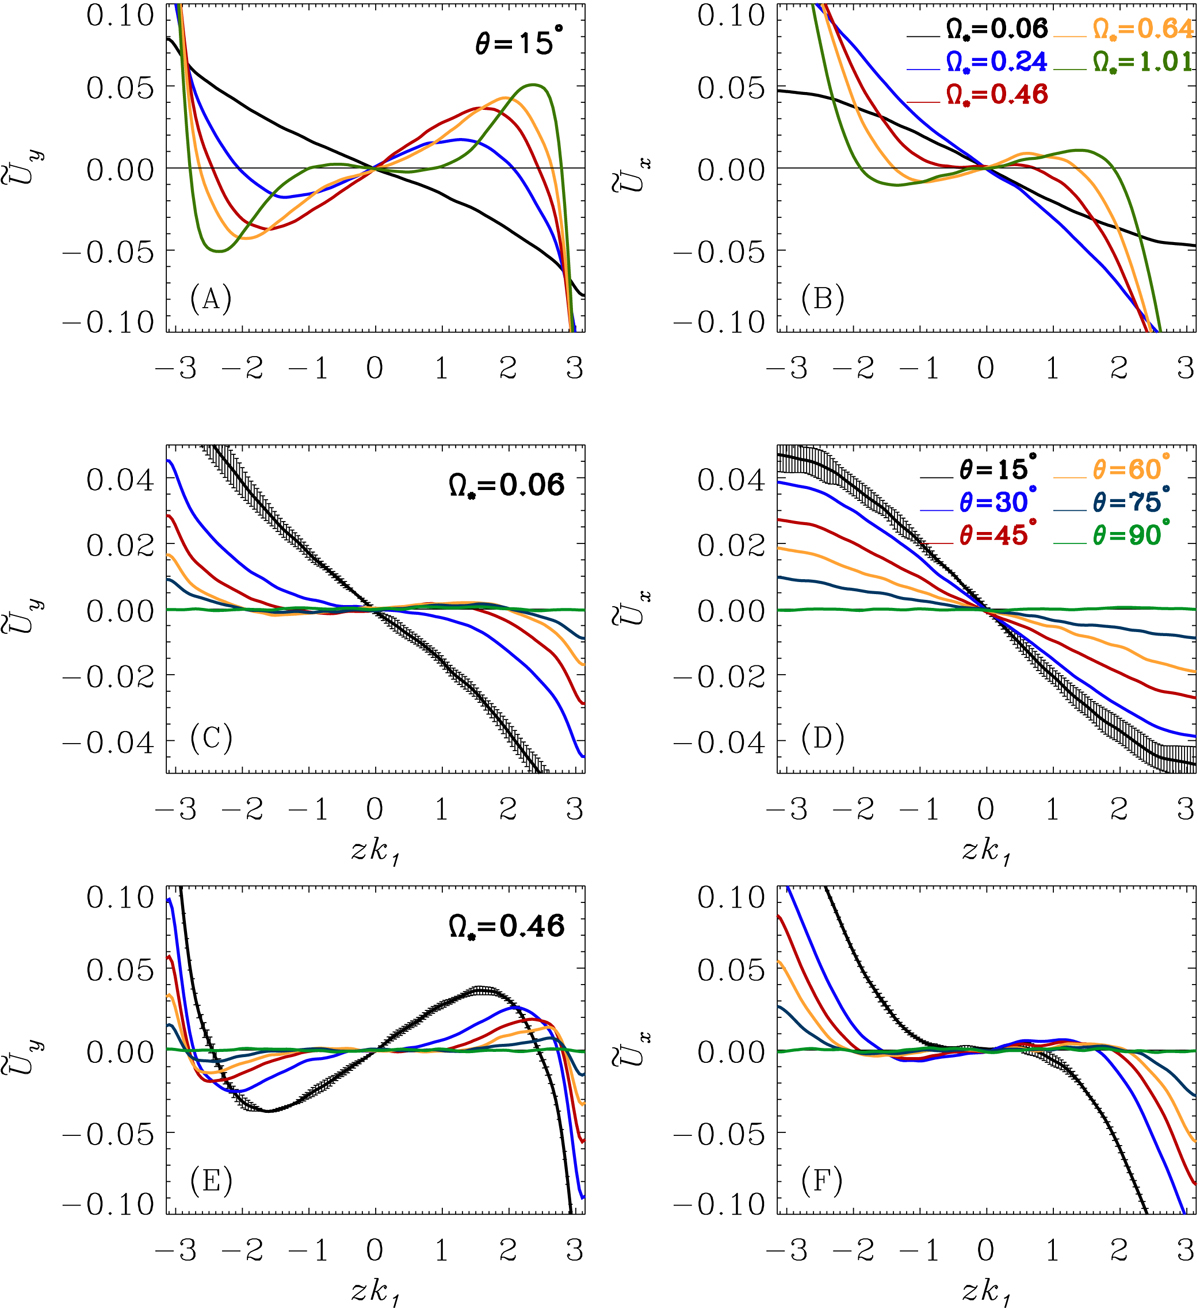
Time-averaged normalized mean velocity components vs. vertical direction. panels A and B show ![]() and
and ![]() at 15°. The second and third rows show the mean horizontal velocities for sets C06 and C46, respectively, at the latitudes indicated in the legends.
at 15°. The second and third rows show the mean horizontal velocities for sets C06 and C46, respectively, at the latitudes indicated in the legends.
Current usage metrics show cumulative count of Article Views (full-text article views including HTML views, PDF and ePub downloads, according to the available data) and Abstracts Views on Vision4Press platform.
Data correspond to usage on the plateform after 2015. The current usage metrics is available 48-96 hours after online publication and is updated daily on week days.
Initial download of the metrics may take a while.