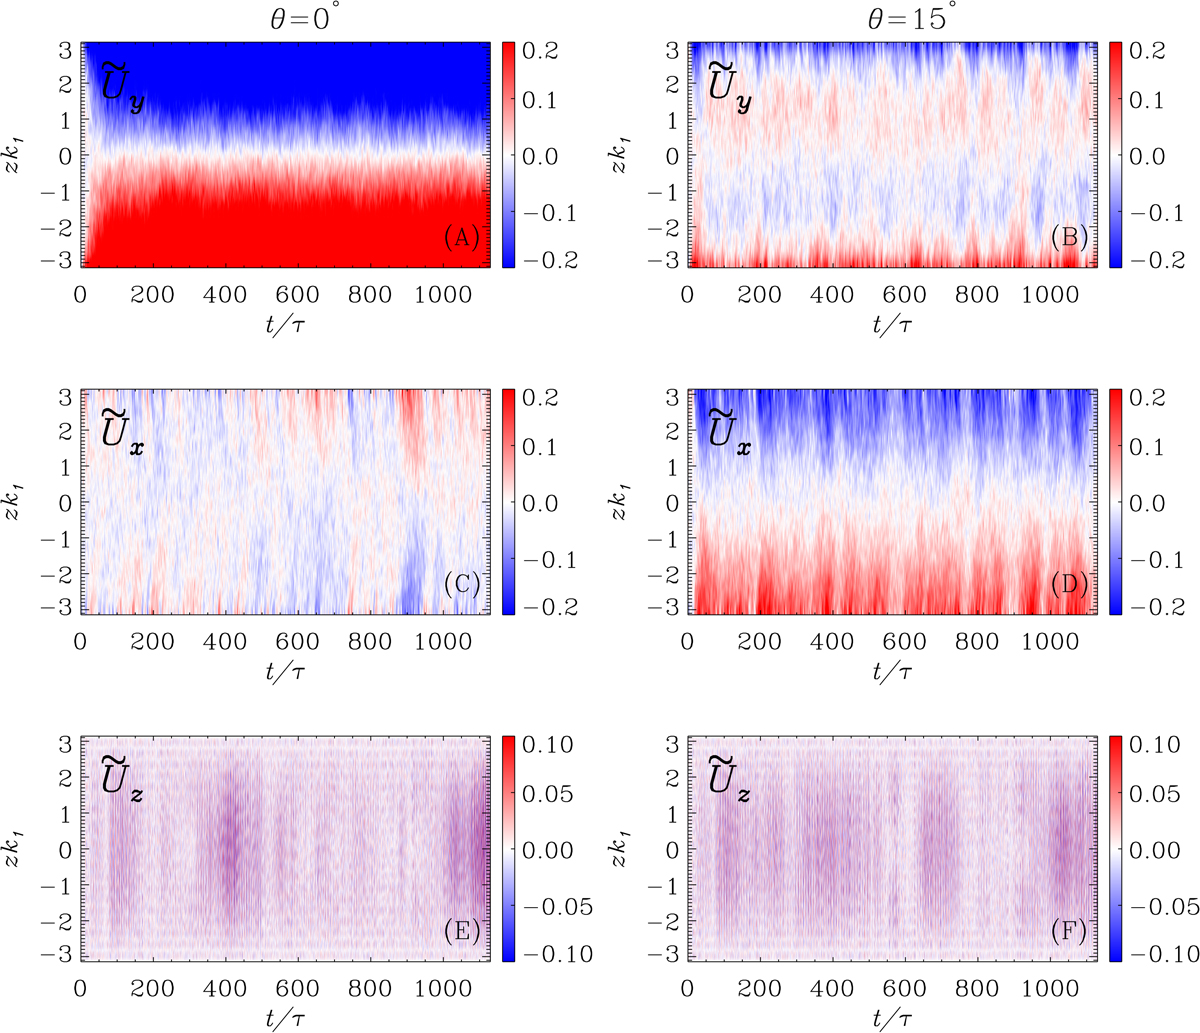
Fig. 4.
Download original image
Normalized mean components of the velocity field vs. time in terms of turnover time in representative runs in set C24. The rows from top to bottom show ![]() ,
, ![]() , and
, and ![]() . The left and right columns show the mean velocities at the equator and at a latitude of 15°, respectively. To make the comparison of the velocity components feasible, we clipped the values of the color table of panel A at 50% of the maximum value.
. The left and right columns show the mean velocities at the equator and at a latitude of 15°, respectively. To make the comparison of the velocity components feasible, we clipped the values of the color table of panel A at 50% of the maximum value.
Current usage metrics show cumulative count of Article Views (full-text article views including HTML views, PDF and ePub downloads, according to the available data) and Abstracts Views on Vision4Press platform.
Data correspond to usage on the plateform after 2015. The current usage metrics is available 48-96 hours after online publication and is updated daily on week days.
Initial download of the metrics may take a while.