Fig. 3.
Download original image
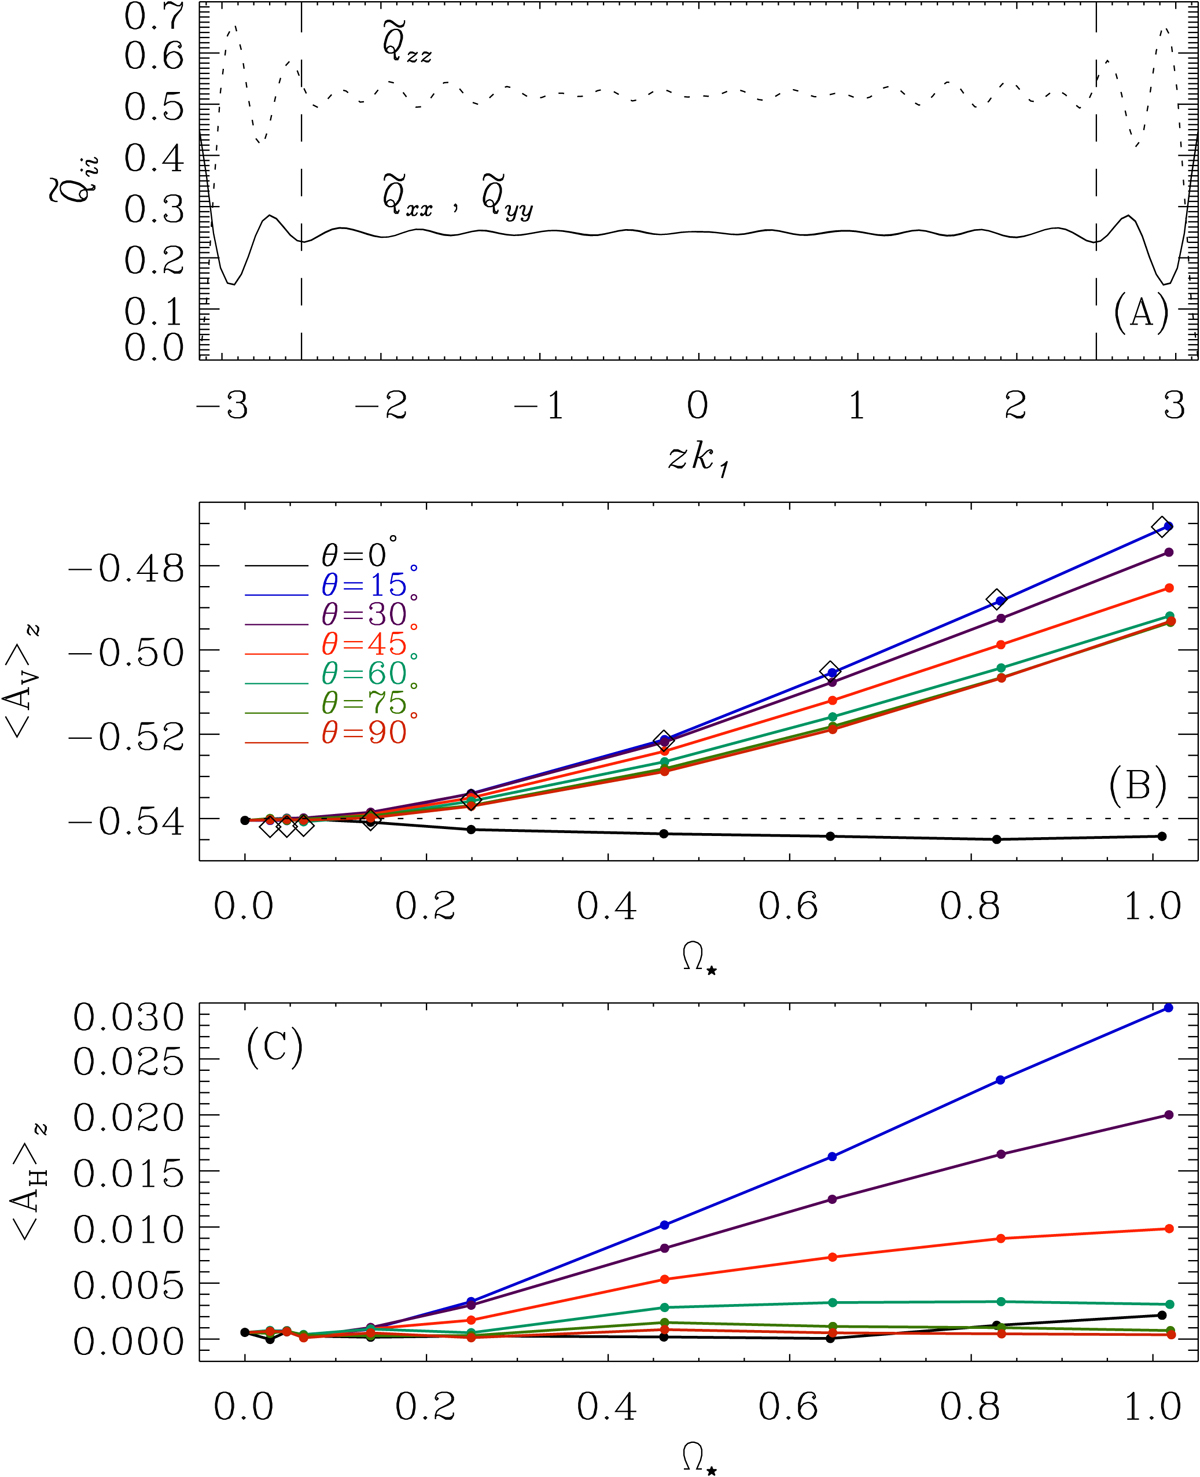
Panel A: time-averaged and normalized diagonal components of the Reynolds stress as functions of z. The dotted (solid) line shows ![]() (
(![]() and
and ![]() ) of set C0. The vertical dashed lines mark the part of the domain from which AV and AH were measured. Anisotropy parameters AVpanel B and AHpanel C are shown as functions of Ω⋆ at the latitudes indicated in the legend. The diamonds in panel B show the values of AV at the equator from the runs from which the mean flow was removed.
) of set C0. The vertical dashed lines mark the part of the domain from which AV and AH were measured. Anisotropy parameters AVpanel B and AHpanel C are shown as functions of Ω⋆ at the latitudes indicated in the legend. The diamonds in panel B show the values of AV at the equator from the runs from which the mean flow was removed.
Current usage metrics show cumulative count of Article Views (full-text article views including HTML views, PDF and ePub downloads, according to the available data) and Abstracts Views on Vision4Press platform.
Data correspond to usage on the plateform after 2015. The current usage metrics is available 48-96 hours after online publication and is updated daily on week days.
Initial download of the metrics may take a while.