Open Access
Fig. 1.
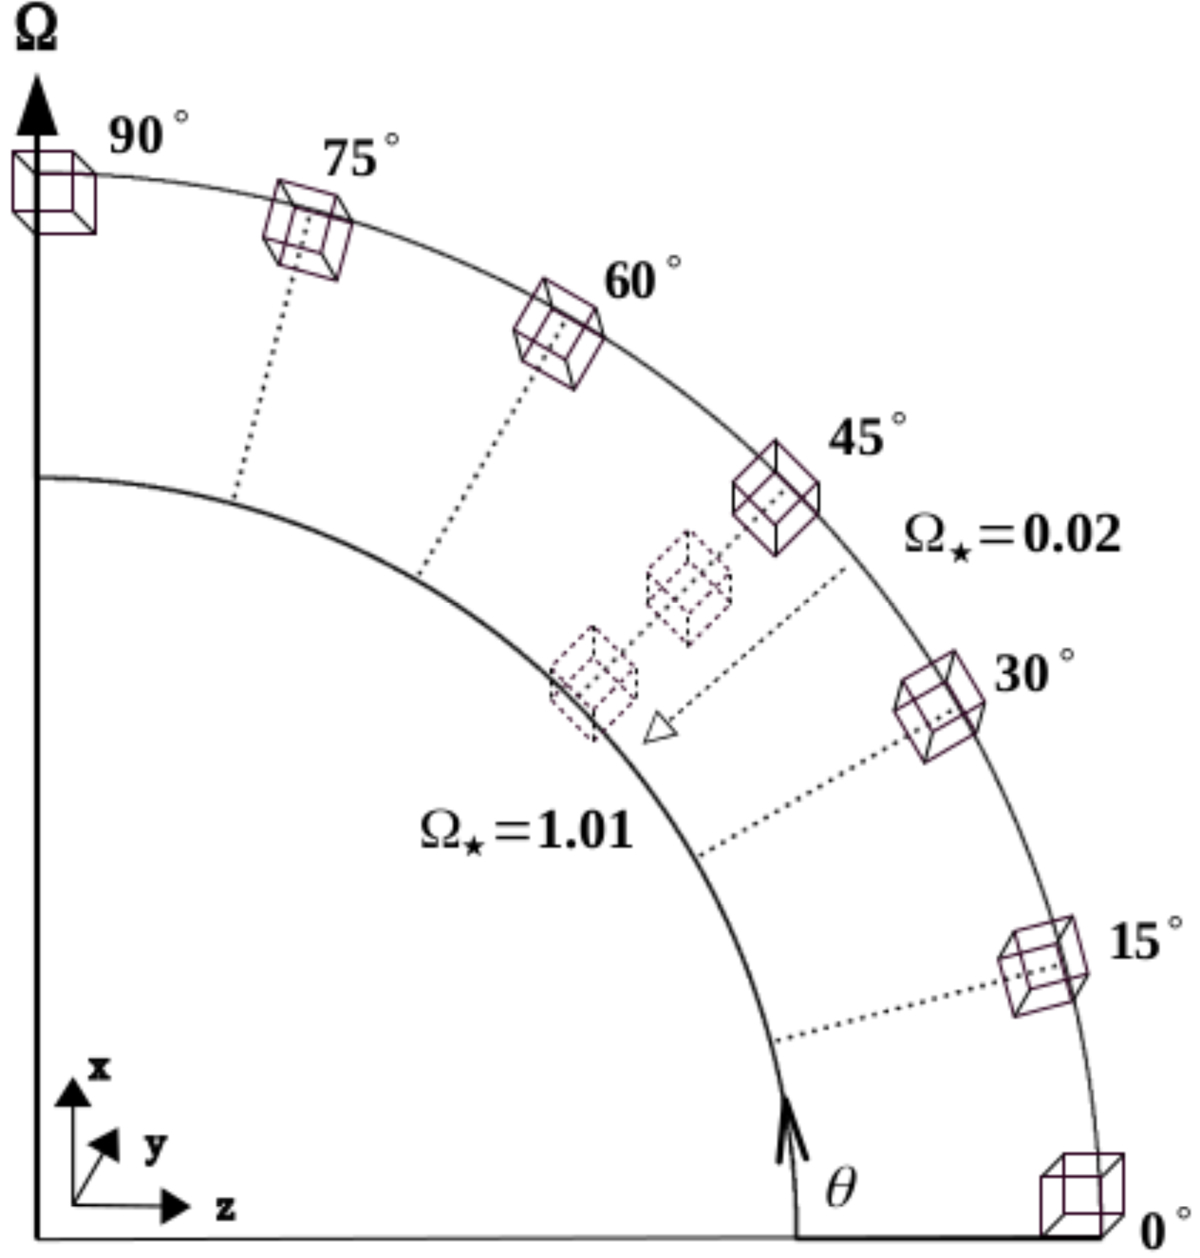
Download original image
Schematic representation of the geometry of the current models and their relation to the NSSL. The depth of the layer is magnified for clarity. The simulation boxes are located at nine depths (not all shown) and seven latitudes. Ω⋆ increases gradually from the surface to the bottom of the NSSL.
Current usage metrics show cumulative count of Article Views (full-text article views including HTML views, PDF and ePub downloads, according to the available data) and Abstracts Views on Vision4Press platform.
Data correspond to usage on the plateform after 2015. The current usage metrics is available 48-96 hours after online publication and is updated daily on week days.
Initial download of the metrics may take a while.