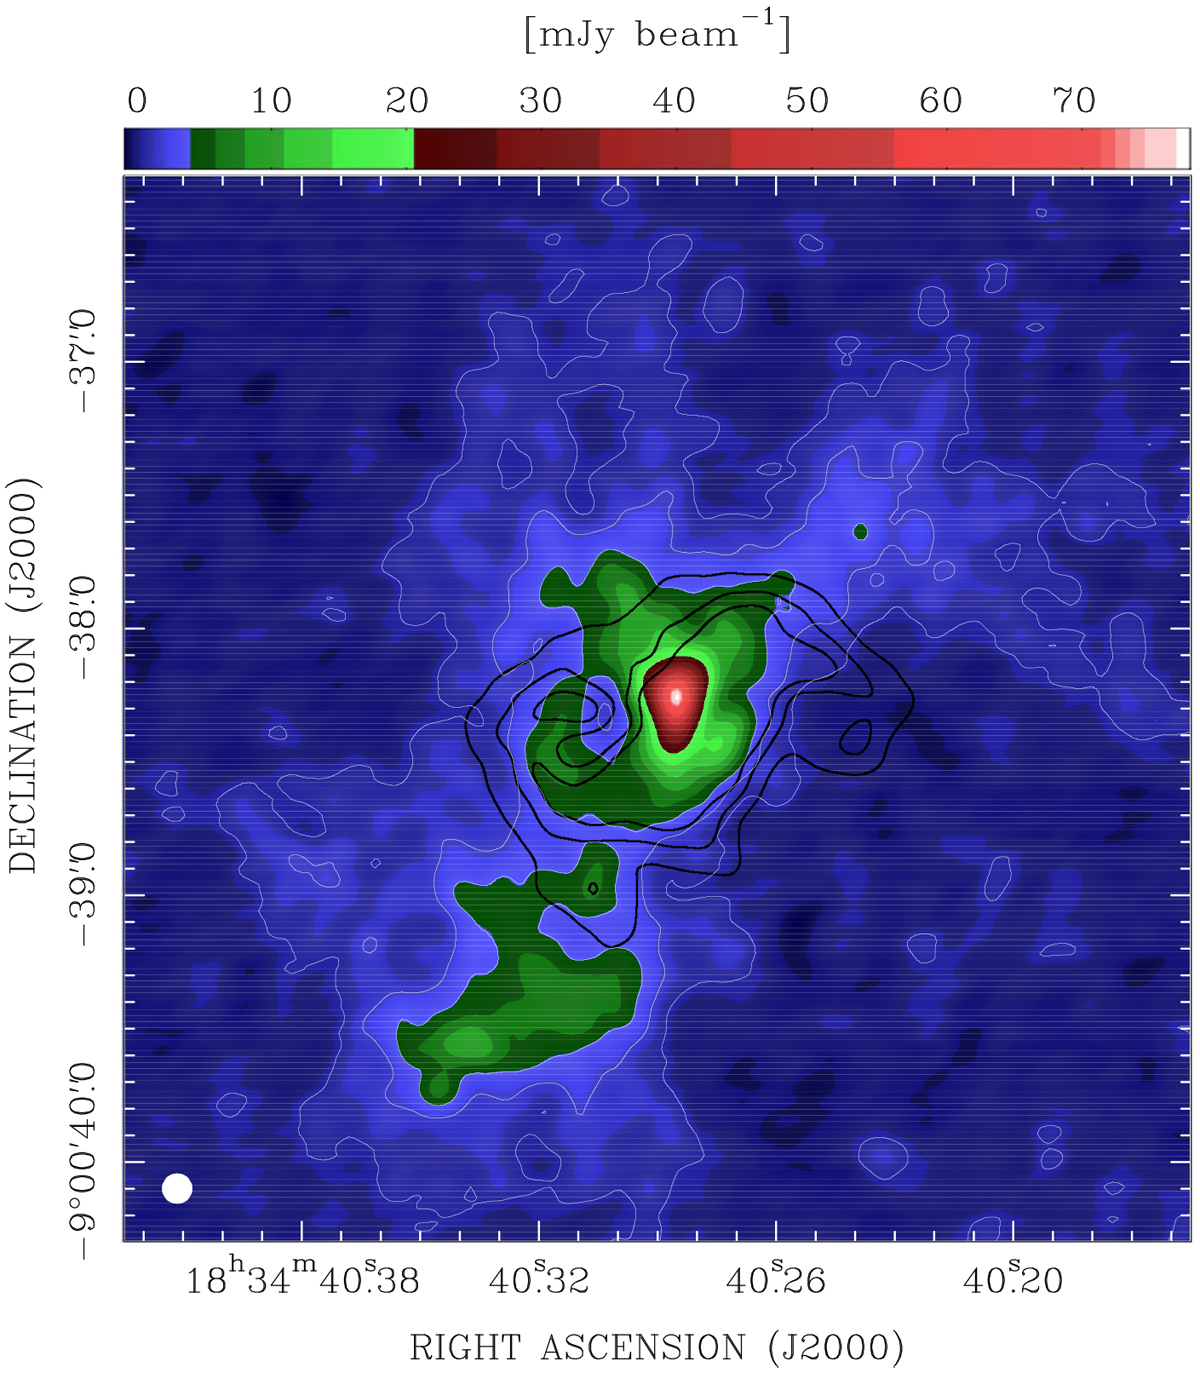
Fig. A.2
Download original image
Dust continuum emission at 860 μm (colours and white contours) imaged with ALMA towards G023.01−00.41 and derivedfrom 52 MHz of emission-free band in the spectra. The upper wedge quantifies the continuum brightness from its peak to the maximum negative in the map; white contours are drawn at levels of 3, 10, and 20 times the 1 σ rms of 0.2 mJy beam−1. The moment-zero map of the CH3OH (141,13–140,14) A+ mission is overlaid with the same black contours of Figs. 1 and 2 for comparison. The synthesized ALMA beam is shown in the bottom left corner.
Current usage metrics show cumulative count of Article Views (full-text article views including HTML views, PDF and ePub downloads, according to the available data) and Abstracts Views on Vision4Press platform.
Data correspond to usage on the plateform after 2015. The current usage metrics is available 48-96 hours after online publication and is updated daily on week days.
Initial download of the metrics may take a while.