Fig. 9.
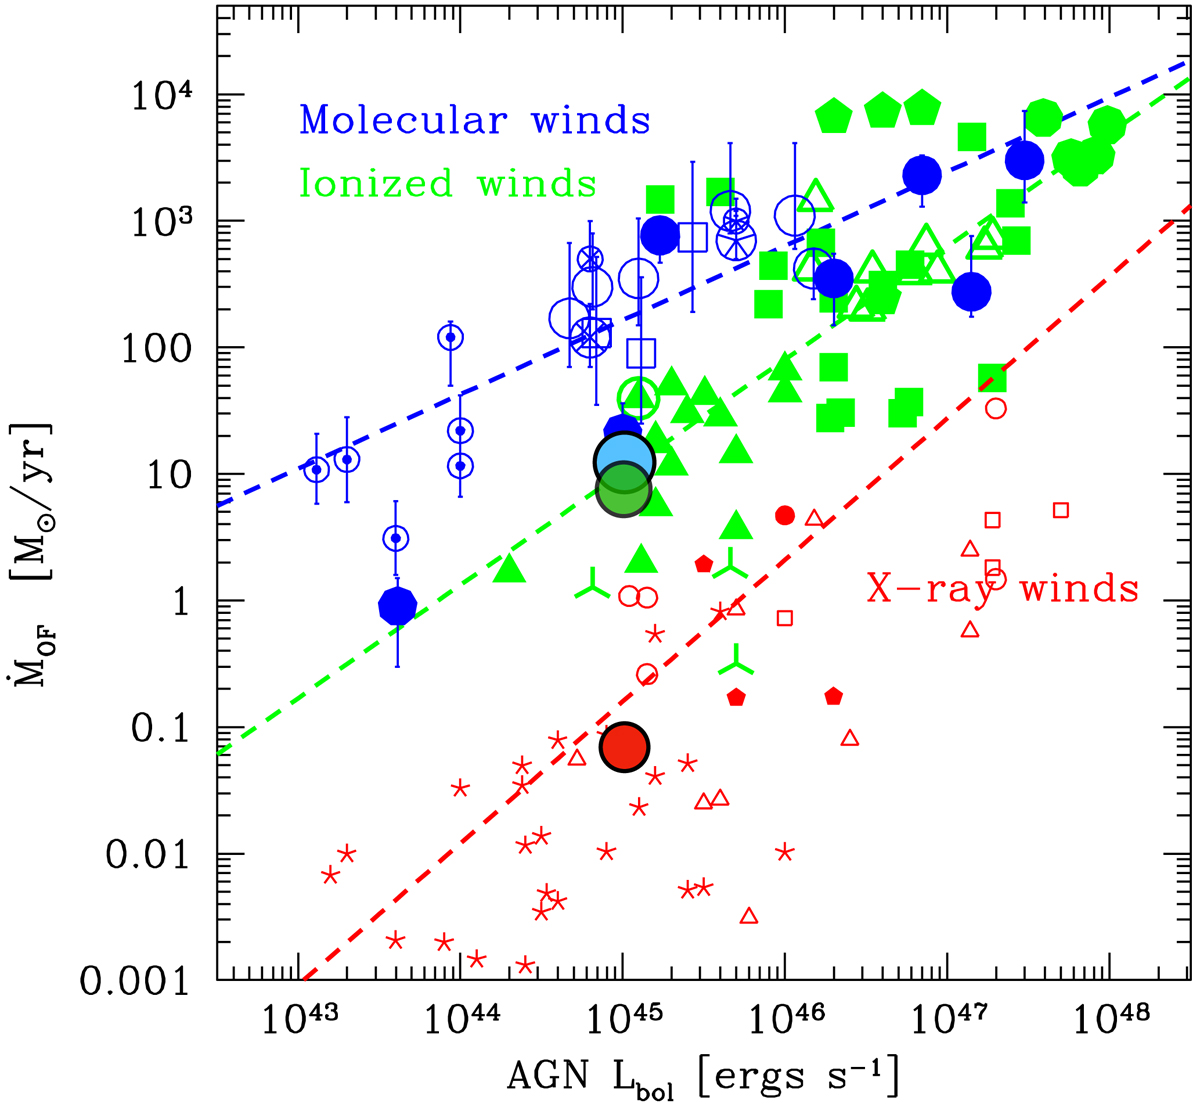
Download original image
Wind mass outflow rate vs. AGN bolometric luminosity for Mrk 509 and a compilation of AGN from (Fiore et al. 2017). For Mrk 509 we plot the Ṁof of the total molecular wind (this work, light blue circle), the ionised wind (green circle Liu et al. 2015), and the UFO (Tombesi et al. 2010, 2011, 2012, red circle). The size of the circles represents the uncertainty in Ṁof. The small blue symbols represent molecular gas winds; the small green symbols represent ionised gas winds; and the small red symbols represent highly ionised gas winds detected in X-rays. The dashed blue, green, and red lines are the best-fit correlations of the molecular, ionised, and X-ray absorbers samples, respectively. Adapted from Fiore et al. (2017).
Current usage metrics show cumulative count of Article Views (full-text article views including HTML views, PDF and ePub downloads, according to the available data) and Abstracts Views on Vision4Press platform.
Data correspond to usage on the plateform after 2015. The current usage metrics is available 48-96 hours after online publication and is updated daily on week days.
Initial download of the metrics may take a while.