Fig. 7.
Download original image
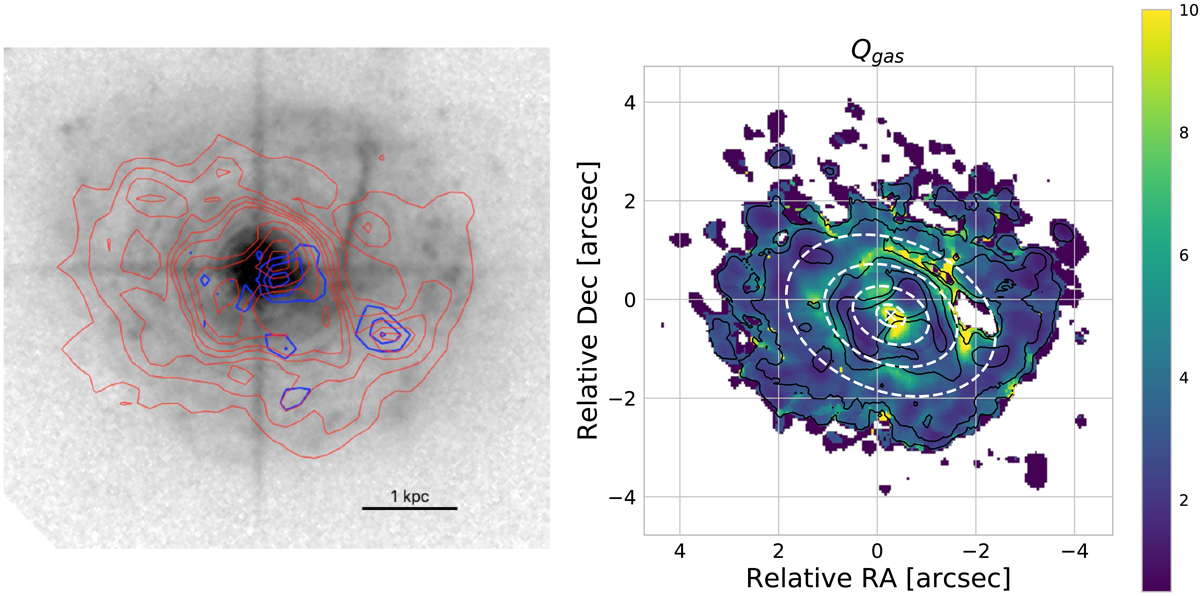
HST [OIII]λ5007 Å image and Toomre Q-parameter map of Mrk 509. Right panel: HST image in the FQ508N filter, probing rest-frame [OIII]λ5007 Å emission (greyscale). The red contours represent CO(2−1) emission (Fig. 1centre panel, contours are drawn at (1, 2, 3, 4, 5, 7, 10, 15, 20, 25, 30, 37) × σ). The blue contours represent CO(2−1) emission in region A and B (Fig. 6 top panel, contours are drawn at (3, 4, 5) × σ). Image from the Mikulski Archive for Space Telescopes (MAST), HST Proposal 12212. Right panel: Toomre Q-parameter map for the cold molecular gas component. The black contours represent the moment 0 CO emission at (2, 5, 15, 30, 45) × σ. The white cross gives the continuum peak position. The white dashed ellipses indicate projected annuli with radius R = 0.3, 0.8, 1.4, 2.2 arcsec (see Table 3).
Current usage metrics show cumulative count of Article Views (full-text article views including HTML views, PDF and ePub downloads, according to the available data) and Abstracts Views on Vision4Press platform.
Data correspond to usage on the plateform after 2015. The current usage metrics is available 48-96 hours after online publication and is updated daily on week days.
Initial download of the metrics may take a while.