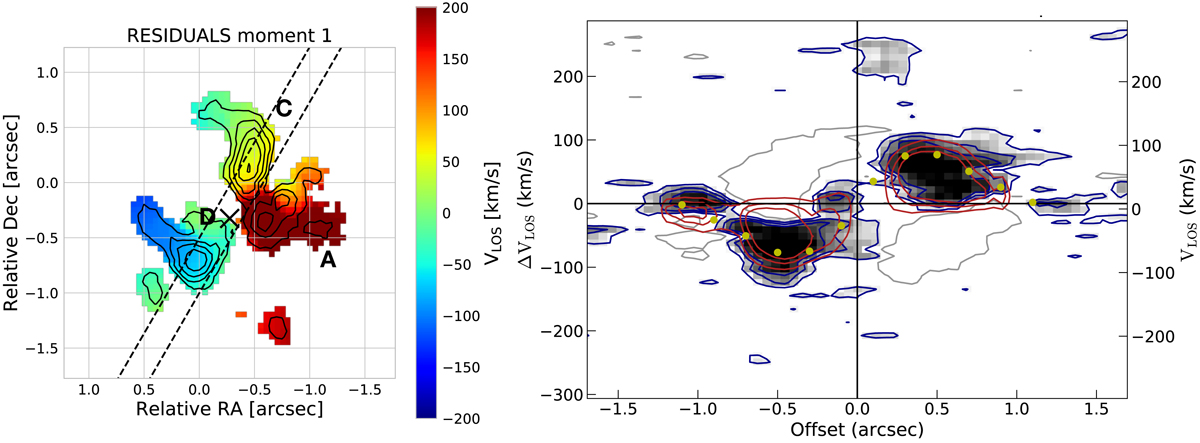
Fig. 5.
Download original image
Moment 1 map and PV diagram from the residual cube. Left panel: velocity map generated from the residual cube obtained subtracting the disc model from the data cube (a mask with a 2σ threshold on the residual intensity map was applied). The black contours show the CO(2−1) emission in residual intensity map at (3, 4, 5, 6, 7) × σ. The black dashed lines represent the slice adopted for the PV diagram (right panel) and comprise the two main kinematic perturbations in the residual intensity map, along PA = 330 deg. The black cross gives the AGN position. Right panel: PV diagram along PA = 330 deg (kinematic major axis). The red contours and yellow points represent the disc model of this inner region; the blue contours represent the data (contours are drawn at (2, 4, 6) × σ). A, C, and D indicate the main dynamical perturbations.
Current usage metrics show cumulative count of Article Views (full-text article views including HTML views, PDF and ePub downloads, according to the available data) and Abstracts Views on Vision4Press platform.
Data correspond to usage on the plateform after 2015. The current usage metrics is available 48-96 hours after online publication and is updated daily on week days.
Initial download of the metrics may take a while.