Fig. 4.
Download original image
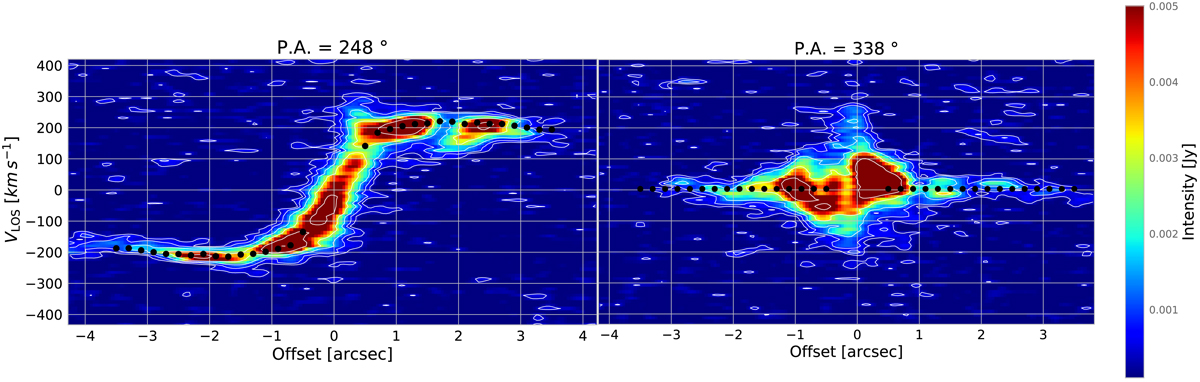
Position-velocity diagrams along the kinematic major and minor axis. Left panel: PV plot along PA = 248 deg (the kinematic major axis). Right panel: PV plot along PA = 338 deg (the kinematic minor axis). The slit width is set to 0.45 arcsec (approximately the FWHM size of the synthetic beam major axis). The white contours refer to data, and are drawn at (1, 2, 4, 8, 16, 32) × σ; the black dots give the VLOS value from the 3DBAROLO model.
Current usage metrics show cumulative count of Article Views (full-text article views including HTML views, PDF and ePub downloads, according to the available data) and Abstracts Views on Vision4Press platform.
Data correspond to usage on the plateform after 2015. The current usage metrics is available 48-96 hours after online publication and is updated daily on week days.
Initial download of the metrics may take a while.