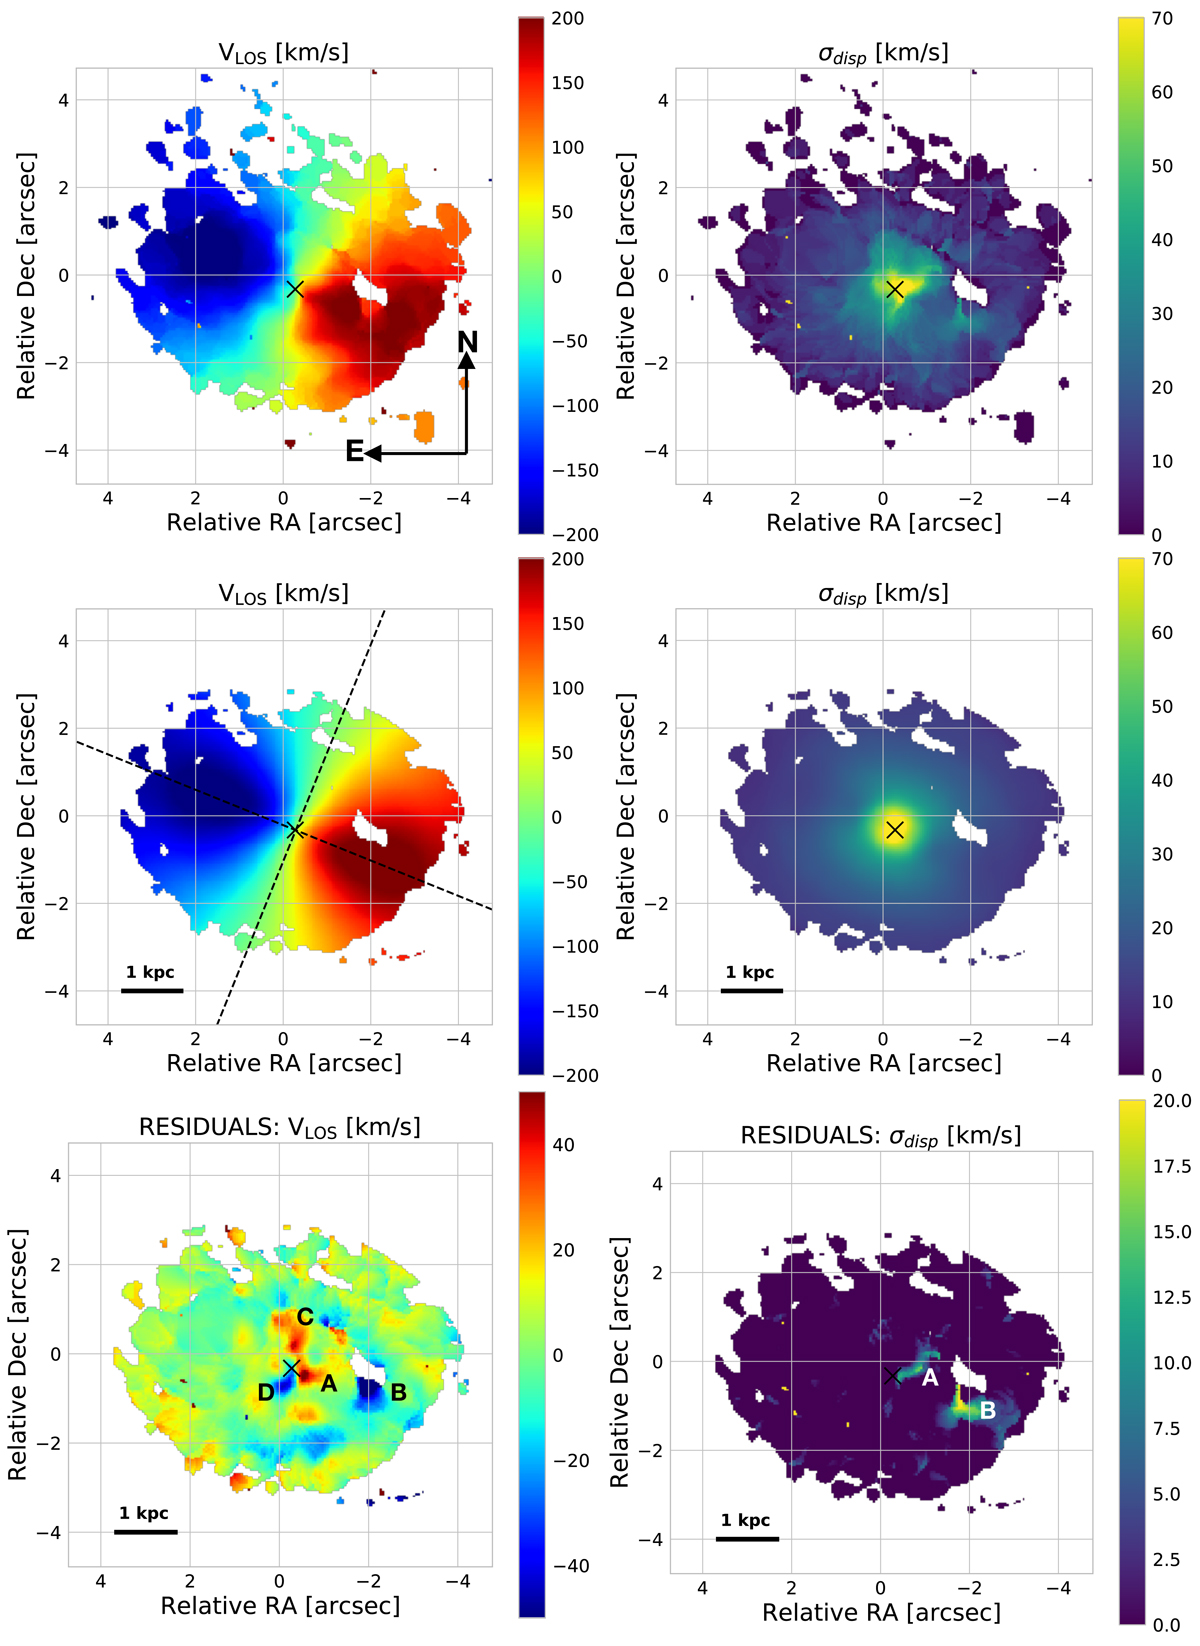
Fig. 2.
Download original image
Comparison between moment 1 and 2 maps generated from data, 3DBAROLO disc model and residuals. Top panels: CO(2−1) moment 1 (top left) and moment 2 (top right) maps. A threshold of 3σ has been applied. The black cross gives the AGN position. Central panels: moment 1 (centre left) and moment 2 (centre right) maps of the 3DBAROLO disc model. The black dashed lines give the orientation of the major and minor kinematic axes (PA = 248 and 338 deg, respectively). Bottom panels: moment 1 (bottom left) and moment 2 (bottom right) maps of the residuals obtained by subtracting the model velocity and velocity dispersion maps from the observed ones. A, B, C, and D indicate the main dynamical perturbations discussed in the text.
Current usage metrics show cumulative count of Article Views (full-text article views including HTML views, PDF and ePub downloads, according to the available data) and Abstracts Views on Vision4Press platform.
Data correspond to usage on the plateform after 2015. The current usage metrics is available 48-96 hours after online publication and is updated daily on week days.
Initial download of the metrics may take a while.