Fig. B.1.
Download original image
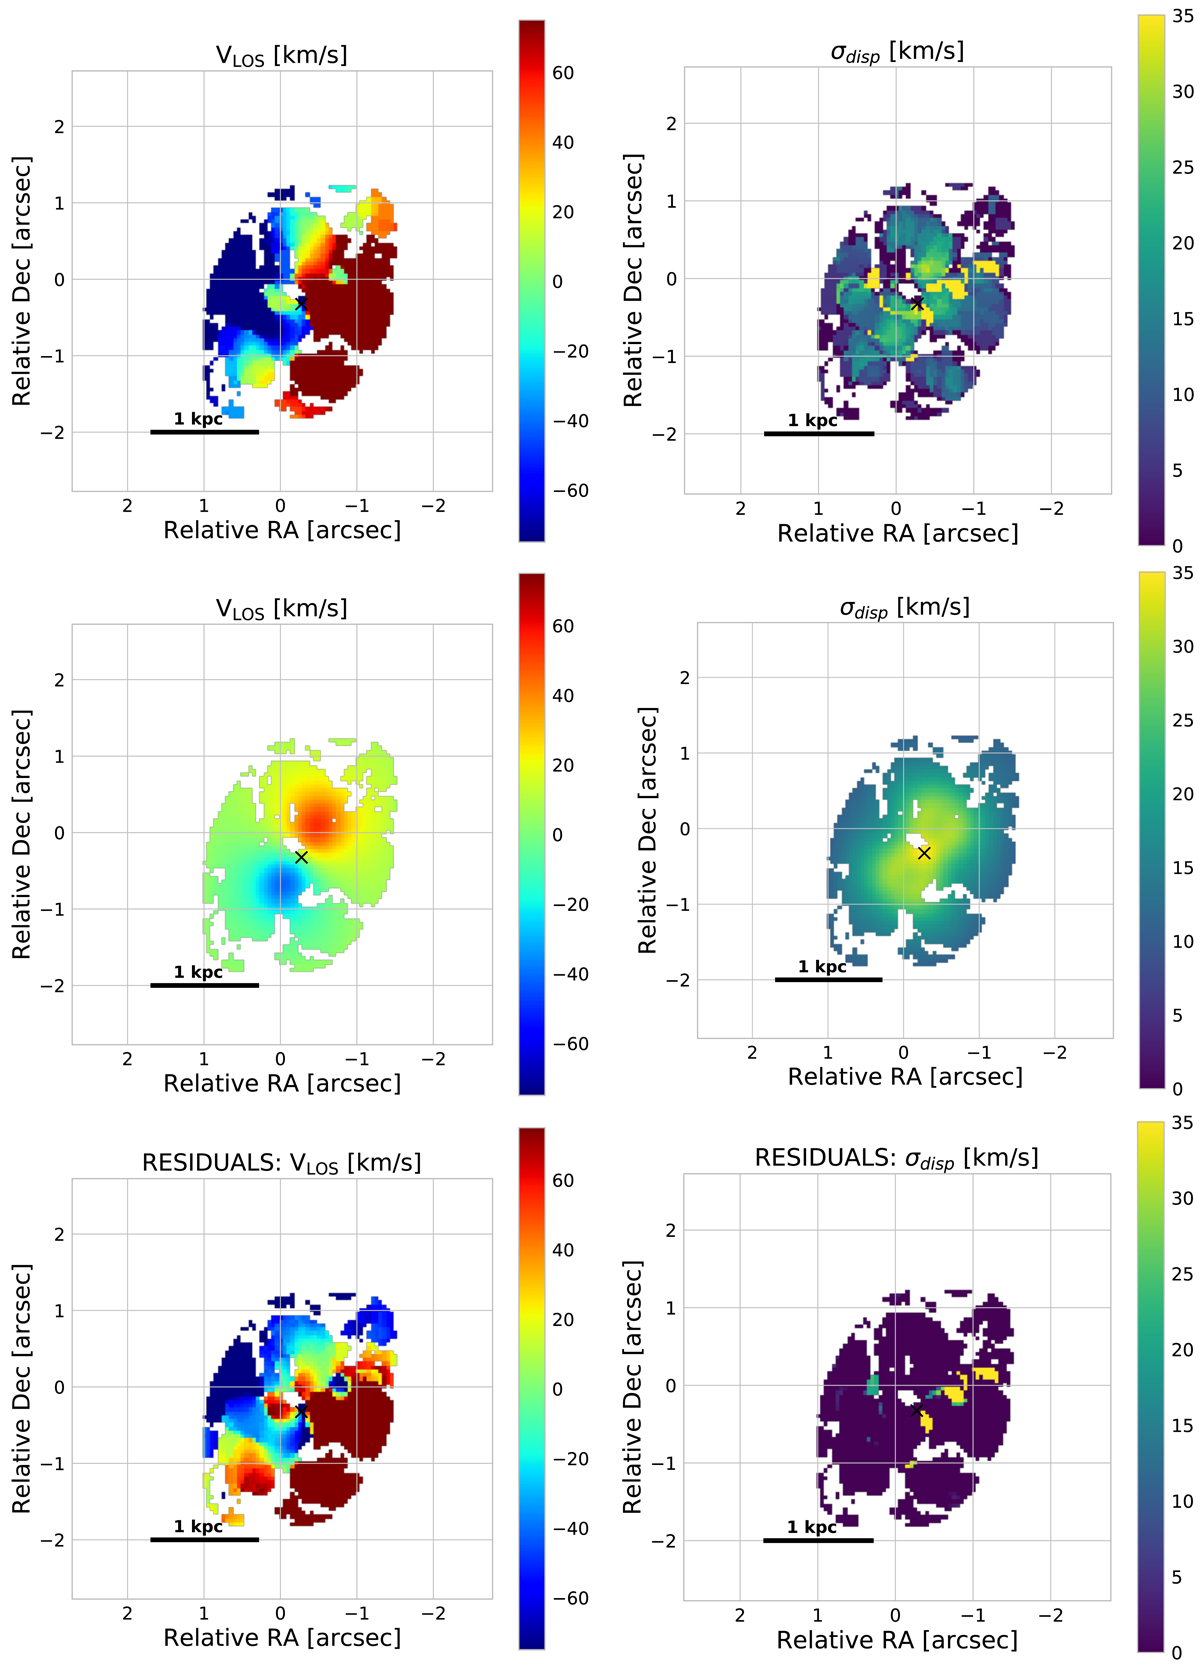
Same as Fig. 2 but for the inner disc model. Top panels: CO(2-1) moment 1 (top left) and moment 2 maps (top right) computed from the data cube, after subtraction of the disc model (Section 3). A threshold of 3σ has been applied. The black cross gives the AGN position. Central panels: Moment 1 (central left) and moment 2 (central right) maps of the disc model of the inner r = 700 pc region. Bottom panels: Moment 1 (bottom left) and moment 2 (bottom right) maps of the residuals obtained by subtracting the model velocity and velocity dispersion maps (central panels) from the observed ones (top panels).
Current usage metrics show cumulative count of Article Views (full-text article views including HTML views, PDF and ePub downloads, according to the available data) and Abstracts Views on Vision4Press platform.
Data correspond to usage on the plateform after 2015. The current usage metrics is available 48-96 hours after online publication and is updated daily on week days.
Initial download of the metrics may take a while.